
6-3-19 Weekly Market Update
The very big picture:
The long-term valuation of the market is commonly measured by the Cyclically Adjusted Price to Earnings ratio, or “CAPE”, which smooths out shorter-term earnings swings in order to get a longer-term assessment of market valuation. A CAPE level of 30 is considered to be the upper end of the normal range, and the level at which further PE-ratio expansion comes to a halt (meaning that increases in market prices only occur in a general response to earnings increases, instead of rising “just because”). The market is currently at that level.
Of course, a “mania” could come along and drive prices higher – much higher, even – and for some years to come. Manias occur when valuation no longer seems to matter, and caution is thrown completely to the wind as buyers rush in to buy first and ask questions later. Two manias in the last century – the 1920’s “Roaring Twenties” and the 1990’s “Tech Bubble” – show that the sky is the limit when common sense is overcome by a blind desire to buy. But, of course, the piper must be paid and the following decade or two are spent in Secular Bear Markets, giving most or all of the mania gains back.
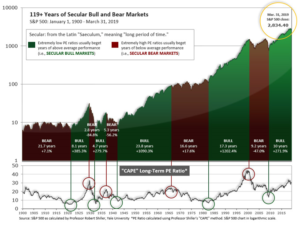
See Fig. 1 for the 100-year view of Secular Bulls and Bears. The CAPE is now at 28.34, down from the prior week’s 29.10, above the level reached at the pre-crash high in October, 2007. Since 1881, the average annual return for all ten year periods that began with a CAPE around this level have been in the 0% – 3%/yr. range. (see Fig. 2).

In the big picture:
The “big picture” is the months-to-years timeframe – the timeframe in which Cyclical Bulls and Bears operate. The U.S. Bull-Bear Indicator (see Fig. 3) is in Cyclical Bull territory at 55.25, down from the prior week’s 59.11.

In the intermediate and Shorter-term picture:
The Shorter-term (weeks to months) Indicator (see Fig. 4) turned negative on March 22nd. The indicator ended the week at 14, down from the prior week’s 20. Separately, the Intermediate-term Quarterly Trend Indicator – based on domestic and international stock trend status at the start of each quarter – was positive entering April, indicating positive prospects for equities in the second quarter of 2019.

Timeframe summary:
In the Secular (years to decades) timeframe (Figs. 1 & 2), the long-term valuation of the market is historically too high to sustain rip-roaring multi-year returns. The Bull-Bear Indicator (months to years) remains positive (Fig. 3), indicating a potential uptrend in the longer timeframe. In the intermediate timeframe, the Quarterly Trend Indicator (months to quarters) is positive for Q2, and the shorter (weeks to months) timeframe (Fig. 4) is negative. Therefore, with two indicators positive and one negative, the U.S. equity markets are rated as Neutral.
In the markets:
U.S. Markets: U.S. stocks fell sharply and closed out their worst month since December as trade tensions ratcheted higher. Small caps, which are usually thought to be less sensitive to global trade tensions than their larger peers, nonetheless performed the worst, and the S&P 400 mid cap index joined small caps in correction territory—defined as more than 10% down from a recent high. The Dow Jones Industrial Average gave up 770 points last week, losing the 25,000 level, and closing at 24,815—a loss of -3.0%. The technology-heavy NASDAQ Composite gave up -2.4% and closed the week at 7,453. By market cap, the large cap S&P 500 declined -2.6%, the mid cap S&P 400 index retreated -2.8%, and the small cap Russell 2000 gave up -3.2%.
International Markets: Canada’s TSX finished down for the fourth week of the last five, losing -1.2%. Across the Atlantic, the United Kingdom’s FTSE fell -1.6%, while on Europe’s mainland France’s CAC 40 retreated -2.1%, Germany’s DAX declined -2.4%, and Italy’s Milan FTSE gave up -2.8%. In Asia, China’s Shanghai Composite gained 1.6%, while Japan’s Nikkei 225 declined -2.4%. As grouped by Morgan Stanley Capital International, developed markets fell -2.1%, while emerging markets rose rebounded 1.9%.
Commodities: Precious metals rose on the weakness in equity markets. Gold rallied 2.1%, or $27.50, to $1311.10 per ounce. Silver managed a 0.1% gain ending the week at $14.57 per ounce. Energy plunged, with West Texas Intermediate crude oil giving up -8.8% and finishing the week at $53.50 per barrel. The industrial metal copper, viewed by analysts as a barometer of global economic activity due to its wide variety of uses, finished the week down -2.2%. Copper has now closed lower for seven consecutive weeks.
May Summary: All major U.S. and International stock markets lost ground in May. The Dow Jones Industrial Average retreated -6.7%, the Nasdaq Composite retreated -7.9%, and the large cap S&P 500 gave up -6.6%. Small caps fell -7.9% and mid caps fared the worst giving up over -8.1%. Canada’s TSX fell -3.3% while the United Kingdom’s FTSE gave up -3.5%. On Europe’s mainland, France’s CAC 40 fell -6.8%, Germany’s DAX retreated -5%, and Italy’s Milan FTSE plunged -9.5%. In Asia, China’s Shanghai Composite fell -5.8% and Japan’s Nikkei retreated ‑7.5%. Developed markets ended the month down -5.0%, while emerging markets fell an even deeper ‑7.3%. Precious metals ended the month mixed: Gold rose 2.0% while Silver declined -2.7%. West Texas intermediate crude oil plunged a whopping -16.3%, while copper gave up -9.1%.
U.S. Economic News: The number of Americans seeking first time unemployment benefits rose slightly to 215,000, but remained near multi-decade lows. The Labor Department reported initial jobless claims rose by 3,000 last week, matching economists’ estimates. The less-volatile monthly average of new claims fell by 3,750 to 216,750. Continuing claims, which counts the number of people already receiving unemployment benefits, declined by 26,000 to 1.66 million. That number is reported with a one-week delay.
The number of homes where a contract has been signed but has not yet closed fell a seasonally-adjusted 1.5% in April and were 2% lower than the same time last year, according to the National Association of Realtors (NAR). Contract signings precede closings by about 45-60 days, so the pending home-sales index is a leading indicator for upcoming existing-home sales reports. By region, only the Midwest saw an increase, with a 1.3% rise. Pending sales were down 1.8% in the Northeast, 2.5% in the South, and 1.8% in the West. Despite the declines, the NAR remained resoundingly upbeat. NAR Chief Economist Lawrence Yun stated, “It’s inevitable for sales to turn higher in a few months.”
The rate of increase in home prices weakened again according to the latest data from S&P CoreLogic. The S&P CoreLogic Case-Shiller home price index rose an annualized 3.7% in March, down from 3.9% in February. As recently as last fall many regions had reported double-digit price increases. The latest report’s largest annual gain was 8.2% in Las Vegas, but Seattle’s previous 13% gain has dropped to just 1.6%. The 20-City Composite index dropped from 6.7% annual gains, to just 2.7% over the past year. David Blitzer, managing director and chairman of the Index Committee at S&P Dow Jones Indices stated, “Given the broader economic picture, housing should be doing better.”
Confidence among the nation’s consumers surged in May to a six-month high, spurred by a robust labor market. The Consumer Confidence Index rose 4.9 points to 134.1 the Conference Board reported. Of note, the survey results were compiled before trade talks between the U.S. and China deteriorated. In the details, the survey that asked Americans how they view the economy at present rose to 175.2—its highest level since December 2000. In addition, the index that tracks how consumers view the economy 6 months from now rose 3.9 points to 106.6. Lynn Franco, director of economic indicators at the Board stated, “Despite weak retail sales in April, these high levels of confidence suggest no significant pullback in consumer spending in the months ahead.”
Americans cut back on spending in April after a surge in March, according to the Commerce Department. Consumer spending rose 0.3% last month, a steep drop from March’s 1.1% increase. Incomes rose 0.5% in April, the largest gain in four months while the Personal Consumption Expenditures index rose 0.3%. The rate of inflation over the past year rose to 1.5%–its highest level since December. Sal Guatieri senior economist at BMO Capital Markets stated, “Despite an escalating trade war, the American consumer is still kicking, and likely to keep the economy moving forward so long as hiring doesn’t give out.”
Consumer sentiment took a hit in the last half of May after the trade dispute between the U.S. and China escalated into another round of retaliatory tariffs. The University of Michigan’s final results for consumer sentiment was lowered 2.4 points to 100 in May, down from its highest reading in 15 years. In the details, over 30% of respondents “spontaneously” mentioned the new tariffs versus just 16% earlier in the month.
First-quarter GDP grew a bit slower than originally reported, predominantly due to weaker business investment, said the government’s Bureau of Economic Analysis. Gross domestic product, the official scorecard for the economy grew at a 3.1% annual pace in the first quarter—down a tick from the initial 3.2% estimate. Economists had expected first-quarter GDP to be revised down to 3%. Of note in the report, adjusted corporate profits before taxes fell at an annual -2.8% pace—the biggest decline since 2015. Chief Economist Scott Brown of Raymond James summed up the report writing, “The first quarter story remains the same — headline GDP growth was boosted by inventories and net exports, while consumer spending and business fixed investment rose at a lackluster pace.”
International Economic News: Canada’s economy expanded at an annualized pace of just 0.4% in the first quarter of 2019, giving the country its weakest back-to-back quarters of growth in four years. Statistics Canada reported the real gross domestic product reading for the first quarter following a revised growth number of just 0.3% in the previous quarter. It was the slowest two-quarter period of growth since the plunge in the price of oil in the first half of 2015. Economists had expected growth at an annualized rate of 0.7 per cent for the first quarter, according to Thomson Reuters Eikon. The Statistics Canada report said downward pressure on first-quarter growth was driven by weakness in net trade as imports increased 1.9% and export volumes dropped 1% for their first quarterly decrease since 2017.
In Europe, Germany’s jobless rate rose for the first time in more than five years in May, the latest sign of trouble for Europe’s largest exporter. Germany’s unemployment rate rose 0.1% to 5%, according to data from the country’s central bank. It marked the first monthly increase since November 2013. Claus Vistesen, chief Eurozone economist at Pantheon Macroeconomics, notes that the rise was partly due to the reclassification of some workers; however, he said it still represented a slowdown in the country’s labor market. “The solid German employment picture will not spontaneously combust this year, but the rate of improvement will deteriorate significantly, reflecting the grueling slowdown in manufacturing,” he said.
In Asia, China’s manufacturing outlook took a sharp downturn in May suggesting that China’s economic problems aren’t over yet, analysts said. China’s manufacturing Purchasing Managers’ Index (PMI) fell to 49.4, a sign that the effects of the U.S.-China trade war are being felt among the nation’s producers. The PMI is designed so that readings above 50 indicate a positive economic outlook, while readings below 50 signify contraction. In the details, the biggest drops were in new orders, which fell to 49.8 from 51.4. In addition, new export orders dropped to 46.5 in May, from 49.2 in April. Finally, the employment PMI sub-index dropped from 47.2 to 47.0—its weakest reading since March 2009.
Bank of Japan Governor Haruhiko Kuroda said this week the global economic outlook is highly uncertain, and that downside risks are escalating due to trade friction, China’s slowing economy and Britain’s negotiations to leave the European Union. Kuroda said Group of 20 meetings this year will discuss current account balances and said bilateral trade measures will not resolve such balances. Japan is hosting the Group of 20 finance ministers and central bankers’ meeting on June 8 and 9. “As president of the G-20, we will lead policy discussions at the meeting with all the relevant information and appropriate evaluations of global economic conditions,” Kuroda said.
Finally: Pick up just about any consumer electronics product at one of the big box retailers and you’ll quickly realize why the growing trade tensions between the U.S. and China are so significant—it seems just about every product is stamped with “MADE IN CHINA”. However, below the surface there is possibly a much more dangerous trade conflict brewing. According to media reports from China, Beijing appears to be gearing up its use of dominance in what are known as “rare earth metals” as a counter to its trade battle with Washington. The U.S. relies on China for about 80% of its rare earths, which are used in a host of applications from smartphones to electric vehicles to sophisticated military gear. Not just “used in”, but “essential to” – these rare earth metals have become an irreplaceable part of modern electronics. So what’s the problem? Many of the rare earth metals are only available from China, so when the Chinese government threatens to shut off rare earth metal exports, they are threatening the very existence of many of our most prized electronics. The following chart illustrates this dangerous dependence (source: Bloomberg)

(sources: all index return data from Yahoo Finance; Reuters, Barron’s, Wall St Journal, Bloomberg.com, ft.com, guggenheimpartners.com, zerohedge.com, ritholtz.com, markit.com, financialpost.com, Eurostat, Statistics Canada, Yahoo! Finance, stocksandnews.com, marketwatch.com, wantchinatimes.com, BBC, 361capital.com, pensionpartners.com, cnbc.com, FactSet.) These are the opinions of WE Sherman and Co and not necessarily those of Cambridge, are for informational purposes only, and should not be construed or acted upon as individualized investment advice.
Securities offered through Registered Representatives of Cambridge Investment Research Inc., a broker-dealer, member FINRA/SIPC. Advisory Services offered through Cambridge Investment Research Advisors, a Registered Investment Adviser. Strategic Investment Partners and Cambridge are not affiliated.
Indices mentioned are unmanaged and cannot be invested into directly. Past performance is no guarantee of future results. All Investing involves risk. Depending on the types of investments, there may be varying degrees of risk. Investors should be prepared to bear loss, including total loss of principal.