
6-10-19 Weekly Market Update
The very big picture:
The long-term valuation of the market is commonly measured by the Cyclically Adjusted Price to Earnings ratio, or “CAPE”, which smooths out shorter-term earnings swings in order to get a longer-term assessment of market valuation. A CAPE level of 30 is considered to be the upper end of the normal range, and the level at which further PE-ratio expansion comes to a halt (meaning that increases in market prices only occur in a general response to earnings increases, instead of rising “just because”). The market is currently at that level.
Of course, a “mania” could come along and drive prices higher – much higher, even – and for some years to come. Manias occur when valuation no longer seems to matter, and caution is thrown completely to the wind as buyers rush in to buy first and ask questions later. Two manias in the last century – the 1920’s “Roaring Twenties” and the 1990’s “Tech Bubble” – show that the sky is the limit when common sense is overcome by a blind desire to buy. But, of course, the piper must be paid and the following decade or two are spent in Secular Bear Markets, giving most or all of the mania gains back.
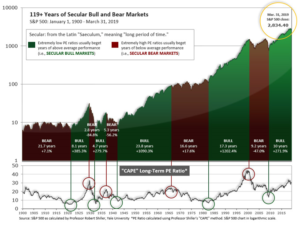
See Fig. 1 for the 100-year view of Secular Bulls and Bears. The CAPE is now at 29.58, up sharply from the prior week’s 28.34, above the level reached at the pre-crash high in October, 2007. Since 1881, the average annual return for all ten year periods that began with a CAPE around this level have been in the 0% – 3%/yr. range. (see Fig. 2).

In the big picture:
The “big picture” is the months-to-years timeframe – the timeframe in which Cyclical Bulls and Bears operate. The U.S. Bull-Bear Indicator (see Fig. 3) is in Cyclical Bull territory at 55.95, up from the prior week’s 55.25.

In the intermediate and Shorter-term picture:
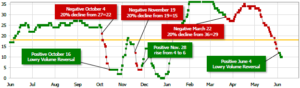
The Shorter-term (weeks to months) Indicator (see Fig. 4) turned positive on June 4th. The indicator ended the week at 10, down from the prior week’s 14. Separately, the Intermediate-term Quarterly Trend Indicator – based on domestic and international stock trend status at the start of each quarter – was positive entering April, indicating positive prospects for equities in the second quarter of 2019.
Timeframe summary:
In the Secular (years to decades) timeframe (Figs. 1 & 2), the long-term valuation of the market is historically too high to sustain rip-roaring multi-year returns. The Bull-Bear Indicator (months to years) remains positive (Fig. 3), indicating a potential uptrend in the longer timeframe. In the intermediate timeframe, the Quarterly Trend Indicator (months to quarters) is positive for Q2, and the shorter (weeks to months) timeframe (Fig. 4) is positive. Therefore, with three indicators positive and none negative, the U.S. equity markets are rated as Positive.
In the markets:
U.S. Markets: U.S. stocks rebounded from their losses in May as belief grew that the Federal Reserve may cut its short-term interest rates later in the year. The large-cap S&P 500 had its best week of the year, surging 4.4% and ending the week within roughly 3% of its all-time high. The Dow Jones Industrial Average surged over 1100 points to close at 25,983, a gain of 4.7%. The technology-heavy NASDAQ Composite rose 3.9%. The mid cap S&P 400 rallied 4.5%, while the small cap Russell 2000 trailed its domestic index brethren by adding “just” 3.3%.
International Markets: Canada’s TSX rebounded 1.2%, while the United Kingdom’s FTSE rose 2.4%. On Europe’s mainland France’s CAC 40 rose 3%, Germany’s DAX added 2.7%, and Italy’s Milan FTSE gained 2.8%. In Asia, major markets were mixed. China’s Shanghai Composite fell -2.5%, while Japan’s Nikkei rose 1.4%. As grouped by Morgan Stanley Capital International, developed markets rallied 3.4%, while emerging markets added 1.2%.
Commodities: Precious metals jumped higher, with Gold rising 2.7% to $1346.10 an ounce and Silver rising 3.2% to $15.03. Oil finished the week up 0.9% closing at $53.99 per barrel of West Texas Intermediate crude. The industrial metal copper, viewed by some analysts as a barometer of global economic health due to its wide variety of uses, ended the week down -0.5%–its eighth consecutive decline, a bit unnerving to many analysts.
U.S. Economic News: The Labor Department reported the number of Americans claiming first-time unemployment benefits remained flat at 218,000 last week as the labor market remained resilient despite growing global trade tensions. Economists had estimated new claims would total 215,000. The more stable monthly average of new claims fell by 2,500 to 215,000, hitting its lowest level since late April. Claims remain far below the key 300,000 threshold that analysts use to gauge a “healthy” jobs market. Continuing claims, which counts the number of people already receiving benefits, rose by 20,000 to 1.68 million. That number sits near a 46-year low.
Just 27,000 people were hired in the private sector during May, payroll processor ADP reported this week. The reading was far short of expectations of 175,000 new private sector jobs. In the report, small businesses cut 52,000 jobs, while medium-sized companies added 11,000 and large companies added 68,000. ADP Chief Economist Mark Zandi stated on CNBC, “Growth is slowing, and it’s slowing very sharply. Business capex is dead in the water.” By industry category, manufacturing industries shed 43,000 jobs, while the service sector added 71,000.
ADP’s report, which many analysts use to get a feel for the Labor Department’s official jobs Non-Farms Payroll (NFP) report, was spot on this time. The U.S. created just 75,000 new jobs in May and employment gains earlier in the spring were scaled back—a worrisome sign that points to a potentially slowing economy. The gains fell far short of expectations for 185,000 new positions. Hiring slowed in almost every key segment of the economy. Professional-oriented companies added 33,000 jobs, while hotels and restaurants boosted payrolls by 26,000, but employment was weak everywhere else. Construction companies hired just 4,000 new workers while retailers shed jobs for a fourth consecutive month. Despite the lower number, the NFP report showed the unemployment rate clung to its 49-year low of 3.6% and the broader measure of joblessness, known as the U6 unemployment rate, dipped to its lowest level in 19 years.
Manufacturing activity in the U.S. grew at its slowest pace in two and a half years last month, according to the Institute for Supply Management (ISM). ISM reported its manufacturing index slipped 0.7 point to 52.1 in the wake of the trade standoff with China and softer auto sales. Economists had expected just a 0.2 point decline. In the details, the production index slipped to 51.3, its lowest reading in almost 3 years, while the index for supplier deliveries fell 2.6 points to 52. While readings over 50 indicate more companies are expanding rather than shrinking, the index has fallen to its lowest level since Donald Trump was elected president.
However, ISM reported the services side (which makes up more than three quarters of the U.S. economy), is still showing plenty of strength. ISM’s services survey rose 1.4 points to 56.9—economists had expected a reading of 55.9. The survey stated executives were “mostly optimistic” despite worries about growing global trade tensions and the ongoing shortage of skilled workers. Numbers over 50 are viewed as positive for the economy, while numbers over 55 are generally considered to be exceptional. In the details, the index for business production climbed 1.7 points to 61.2, while the new orders index hit 58.6. The index for employment rose 4.4 points to 58.1—just shy of its all-time high. Altogether 16 of the 17 service industries tracked by ISM said their businesses were expanding.
The nation’s trade deficit fell 2.1% in April, but both imports and exports declined. The Bureau of Economic Analysis reported the U.S. trade deficit slipped to $50.8 billion from a revised $51.9 billion in March. Economists had expected a $50.4 billion gap. On the export side, the U.S. shipped fewer commercial aircraft, petroleum-based products, autos, and pharmaceuticals, while imports of chemicals, semiconductors, and cell phones also declined. The trade deficit in goods with China rose 30% to an unadjusted $26.9 billion, though it’s still on track to be lower in 2019 than it was in 2018.
The Federal Reserve’s Beige Book reported the U.S. economy grew at “a moderate pace overall” in late spring. The Beige Book is a summary and analysis of economic conditions compiled from reports from each of the Federal Reserve’s member banks. This latest report was a bit more upbeat compared to the previous report that described U.S. growth as “slight to moderate”. However analysts were quick to point out that this latest report was produced just a few days after the breakdown in trade talks with China that triggered a new round of tariffs.
International Economic News: The Canadian dollar hit a seven-week high against the U.S. dollar this week, boosted by economic data showing record low unemployment, which could give the Bank of Canada more confidence in its rosy outlook for the economy. Canada added a higher-than-expected 27,700 new jobs in May while its unemployment rate fell to a record low of 5.4%, official data showed. Chief Canada strategist at TD Securities stated, “The labour market looks like it is holding up, so I think they (the Bank of Canada) are very comfortable with policy rates where they are.” Despite the positive report analysts noted chances of an interest rate cut by the central bank this year stayed high, at about 85%, after the Canadian jobs report.
Research firm IHS Markit reported its Purchasing Managers’ Index (PMI) for the United Kingdom’s services sector showed British economic growth almost ground to a halt last month. Modest expansion among services firms barely offset weakness in manufacturing and construction due to the Brexit crisis and slowing global growth the business survey said. The IHS Markit/CIPS services Purchasing Managers’ Index (PMI) edged up to 51.0 from 50.4 in April, its strongest reading in three months and slightly above economists’ average forecast in a Reuters poll. IHS Markit economist Chris Williamson wrote, “The PMI surveys collectively indicated that the UK economy remained close to stagnation midway through the second quarter.”
French Finance Minister Bruno Le Maire stated the European Union must overhaul its antitrust rules that leave the continent’s economy and companies vulnerable to U.S. and Chinese rivals. Addressing an international conference on competition and the digital economy, Le Maire said the European Commission should take a broader view before blocking potential mergers within Europe and look more closely at the potential benefits. “To be pertinent and effective, the rules of competition must adapt to new economic realities,” Le Maire wrote. “We can’t stand by…hoping everyone else will respect the rules we force upon ourselves.”
Economic clouds gathered over Germany, the Eurozone’s industrial powerhouse, following the release of gloomy official figures by the Federal Statistics Office. Industrial production in Germany fell by 1.9% compared with the previous month and exports were 0.5% lower than the same time last year. The decline was the most in almost four years. In addition, new forecasts from Germany’s Bundesbank reflect more downbeat prospects. The bank is now predicting growth of just 0.6% for this year, compared with a considerably higher forecast of 1.6% it made in December.
Chinese government officials summoned major international technology companies this week, warning them that they will face consequences for complying with the Trump administration’s sales ban of certain American technologies to Chinese companies. The move came after the Trump administration cut off the Chinese electronics company Huawei from sales of American technology.
The Japanese government maintained its assessment of the economy in April as “worsening”, in line with its view from a month earlier, the Cabinet Office reported. According to a preliminary report, its coincident index of business conditions rose 0.8 point from a month earlier to 101.9. However, the improvement wasn’t enough to improve the Cabinet Office’s expression from “worsening”—the lowest evaluation of the five terms it uses to assess its key index. The evaluation, the worst in more than six years, comes as the nation grapples with simultaneously-slumping overseas demand and ballooning social welfare costs, while also facing the potential fallout from a planned consumption tax hike from 8% to 10% in October.
Finally: By just about any fundamental measure, the U.S. equity market appears overvalued, analysts say. Five traditional measures of stock market valuation–the cyclically-adjusted P/E ratio (or CAPE), made famous by Nobel prize –winning Yale professor Robert Shiller; the price-to-book ratio, price-to-sales ratio and the dividend yield all saw a vast majority of past bull markets peak at lower valuations than April’s readings. In other words, in April the market was more overvalued than it was at the peaks of 86% to 100% of all past bull markets. (Chart: Mark Hulbert, marketwatch.com)

(Sources: all index return data from Yahoo Finance; Reuters, Barron’s, Wall St Journal, Bloomberg.com, ft.com, guggenheimpartners.com, zerohedge.com, ritholtz.com, markit.com, financialpost.com, Eurostat, Statistics Canada, Yahoo! Finance, stocksandnews.com, marketwatch.com, wantchinatimes.com, BBC, 361capital.com, pensionpartners.com, cnbc.com, FactSet) These are the opinions of WE Sherman and Co and not necessarily those of Cambridge, are for informational purposes only, and should not be construed or acted upon as individualized investment advice.
Securities offered through Registered Representatives of Cambridge Investment Research Inc., a broker-dealer, member FINRA/SIPC. Advisory Services offered through Cambridge Investment Research Advisors, a Registered Investment Adviser. Strategic Investment Partners and Cambridge are not affiliated.
Indices mentioned are unmanaged and cannot be invested into directly. Past performance is no guarantee of future results. All Investing involves risk. Depending on the types of investments, there may be varying degrees of risk. Investors should be prepared to bear loss, including total loss of principal.