
5-27-19 Weekly Market Update
The very big picture:
The long-term valuation of the market is commonly measured by the Cyclically Adjusted Price to Earnings ratio, or “CAPE”, which smooths out shorter-term earnings swings in order to get a longer-term assessment of market valuation. A CAPE level of 30 is considered to be the upper end of the normal range, and the level at which further PE-ratio expansion comes to a halt (meaning that increases in market prices only occur in a general response to earnings increases, instead of rising “just because”). The market is currently at that level.
Of course, a “mania” could come along and drive prices higher – much higher, even – and for some years to come. Manias occur when valuation no longer seems to matter, and caution is thrown completely to the wind as buyers rush in to buy first and ask questions later. Two manias in the last century – the 1920’s “Roaring Twenties” and the 1990’s “Tech Bubble” – show that the sky is the limit when common sense is overcome by a blind desire to buy. But, of course, the piper must be paid and the following decade or two are spent in Secular Bear Markets, giving most or all of the mania gains back.
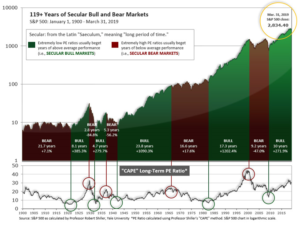
See Fig. 1 for the 100-year view of Secular Bulls and Bears. The CAPE is now at 29.10, down from the prior week’s 30.14, above the level reached at the pre-crash high in October, 2007. Since 1881, the average annual return for all ten year periods that began with a CAPE around this level have been in the 0% – 3%/yr. range. (see Fig. 2).

In the big picture:
The “big picture” is the months-to-years timeframe – the timeframe in which Cyclical Bulls and Bears operate. The U.S. Bull-Bear Indicator (see Fig. 3) is in Cyclical Bull territory at 59.11, down from the prior week’s 62.85.

In the intermediate and Shorter-term picture:
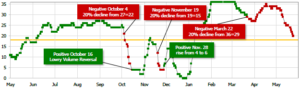
The Shorter-term (weeks to months) Indicator (see Fig. 4) turned negative on March 22nd. The indicator ended the week at 20, down from the prior week’s 25. Separately, the Intermediate-term Quarterly Trend Indicator – based on domestic and international stock trend status at the start of each quarter – was positive entering April, indicating positive prospects for equities in the second quarter of 2019.
Timeframe summary:
In the Secular (years to decades) timeframe (Figs. 1 & 2), the long-term valuation of the market is historically too high to sustain rip-roaring multi-year returns. The Bull-Bear Indicator (months to years) remains positive (Fig. 3), indicating a potential uptrend in the longer timeframe. In the intermediate timeframe, the Quarterly Trend Indicator (months to quarters) is positive for Q2, and the shorter (weeks to months) timeframe (Fig. 4) is negative. Therefore, with two indicators positive and one negative, the U.S. equity markets are rated as Neutral.
In the markets:
U.S. Markets: Stocks in the U.S. ended the week lower, with the technology-heavy NASDAQ Composite bearing the brunt of the selling. The Dow Jones Industrial Average ended the week down 178 points to 25,585, a decline of -0.7%. The NASDAQ declined for a third consecutive week, giving up -2.3%. By market cap, the large cap S&P 500 ended down -1.2%, while both the mid cap S&P 400 and small cap Russell 2000 ended down -1.4%.
International Markets: Canada’s TSX declined -1.1% while in Europe major markets were also a sea of red. The United Kingdom’s FTSE 100 ended down -1%, while on the mainland France’s CAC 40 retreated -2.2%, Germany’s DAX ended down -1.9%, and Italy’s Milan FTSE slumped -3.5%. In Asia, China’s Shanghai Composite declined for a fifth consecutive week, down -1%, while Japan’s Nikkei ended down -0.6%. As grouped by Morgan Stanley Capital International, developed markets managed a 0.02% gain, while emerging markets ended down -0.8%.
Commodities: Precious metals managed to get bid higher in the midst of the weakness in the equities markets, with Gold rising $7.90 to $1283.60 an ounce, a gain of 0.6%, while Silver rebounded 1.2% to $14.56 an ounce. But oil plunged this week, giving up -6.8% and closing at $58.63 a barrel. The industrial metal copper, viewed by analysts as a barometer of global economic health due to its wide variety of uses, finished down a sixth consecutive week, dropping -1.4%.
U.S. Economic News: The number of Americans seeking first-time unemployment benefits downticked by 1,000 to 211,000, remaining near a 50-year low and signaling that the U.S. jobs market remains strong. Economists had expected new claims would rise to 217,000. The more stable monthly average of new claims fell by 4,750 to 220,250. Continuing claims, which counts the number of people already receiving benefits, rose slightly to 1.68 million. That number is reported with a one-week delay.
New-home sales declined 7% last month after reaching the best level of the latest cycle. The Commerce Department reported new-home sales were at a seasonally-adjusted 673,000 annual rate in April, slightly exceeding the consensus forecast for a 670,000 pace of sales. Despite the decline, the trend in new-home sales remains solidly up. March’s revised sales figures were the highest since October 2007, and there were upward revisions to every month back to December. Sales were 7% higher than April of last year. In the details, the median sales price in April, $342,200, was 8% higher than a year ago. At the current pace of sales, it would take 5.9 months to exhaust available supply, about matching the 6 months that has traditionally been considered the marker of an evenly balanced market.
Sales of existing homes fell for the second consecutive month last month, according to the National Association of Realtors (NAR). The NAR reported existing-home sales ran at a seasonally-adjusted annual rate of 5.19 million. That was 0.4% lower than March and 4.4% lower than the same time last year. The number missed economists’ expectations of a 5.35 million selling pace. In the details, the median selling price in April was $267,300, a 3.6% annual increase. At the current pace of sales, there is a 4.2 month supply of homes available on the market—well below the 6-month threshold that’s generally considered to be a balanced housing market. Properties stayed on the market for an average of 24 days in April. By region, sales were down 4.5% in the Northeast and 0.4% in the South. They were flat in the Midwest and up 1.8% in the West.
With less demand from both domestic and foreign buyers and a flare-up in U.S.-China trade tensions, American manufacturers grew at their slowest pace since before U.S. President Donald Trump was elected, research firm IHS Markit reported. Markit’s “flash” survey of U.S. manufacturers declined to a nine-and-a-half year low of 50.6 this month, down 2 points from April. Analysts note that even more ominously, the firm’s survey of U.S. service-oriented companies such as banks and retailers declined almost 2 points to a 39-month low of 50.8 – ominous because services companies employ about 80% of all U.S. workers. Although numbers over 50 indicate companies are growing, the sharp declines in both the manufacturing and services indexes suggest the economy could slow in the months ahead—especially if the dispute with China drags on.
Activity in the manufacturing sector was a significant drag on overall economic activity in April, according to the Chicago Federal Reserve’s National Activity Index (CFNAI). The CFNAI registered -0.45 in April, down from 0.05 in March. Due to the index’s volatile nature, a smoothed three-month moving average is used to analyze trends. The three-month average decreased to -0.32 in April, down from -0.24 in March. The CFNAI is a weighted average of 85 economic indicators, designed so that zero represents trend growth and a three-month average greater than 0.70 suggests an increasing likelihood of increased inflation. Production-related indicators, meaning factory-related, declined to -0.44 in April, down from -0.04 in March. In the details, 33 of the 85 indicators made positive contributions, while 52 weighed.
The Commerce Department reported that orders for goods expected to last at least three years, so-called “durable goods”, dropped 2.1% last month. The decline was attributed to falling demand for Boeing aircraft as well as new cars and trucks. However, of greater concern was that business investment continued to weaken as the trade dispute with China escalated. The big drop in orders was mostly attributed to a drop-off in orders for Boeing jetliners. The giant manufacturer received just four orders in April following the worldwide suspension of flights of its 737 MAX planes. Even after stripping out both aircraft and defense spending, core capital-goods orders declined for the first time in four months, down -0.9%. These orders strip out both aircraft and defense spending to get a better read on how much the private sector is investing. The yearly pace of business investment slowed in April to 1.3% from 3.8%, marking the smallest annual increase since the final month of Barack Obama’s presidency in January 2017.
Minutes from the Federal Reserve’s last interest-rate meeting showed that members felt comfortable with their “patient” stance on rates, and agreed that it could last for “some time”. The Fed Open Market Committee (FOMC) held its target range for the federal-funds rate at 2.25% to 2.5%. “Members observed that a patient approach to determining future adjustments to the target range for the federal-funds rate would likely remain appropriate for some time, especially in an environment of moderate economic growth and muted inflation pressures, even if global economic and financial conditions continued to improve,” the minutes said. The minutes further noted that officials were split on the outlook for interest rates over the longer term. Ian Shepherdson, chief economist at Pantheon Macroeconomics wrote in a note, “No one is pushing for a near-term shift in policy, in either direction.”
International Economic News: With Canadian financial giants such as Toronto-Dominion Bank and Royal Bank of Canada announcing their earnings results this week, it became clear that their wealth management and U.S. operations arms were doing more to increase earnings than their mainstay of domestic consumer lending. The revelation came as no surprise to David Baskin at Baskin Wealth Management who noted, “I’m not surprised that the domestic [Canadian] operations are pretty flat. The reason that TD and RBC in particular went south [to the US] was to find greener fields.” Much of Canada is experiencing a housing slowdown and household debt is at a record high. In addition, the country is a mature market for banking where lenders get much of their growth by stealing market share from each other.
Despite its political turmoil, the United Kingdom’s economy remained remarkably stable, according to data from the Office for National Statistics (ONS). The ONS reported prices rose at an annual rate of 2.1% last month, up slightly from the 1.9% recorded in March, but below the 2.2% forecast by economists. Public borrowing came in at 5.8 billion pounds, almost the same as the year ago number, while house prices rose 1.4% in March compared to the same month a year ago. The ONS stated the data is consistent with a stable UK economy. Growth is modest with inflation under control, while at the same time unemployment is at multi-decade lows. John Hawksworth, chief economist at PricewaterhouseCoopers said: “Today’s data confirm that the public finances are back in decent shape after nine years of austerity.”
Confidence among German business owners hit its lowest level in more than four years. The Munich-based Ifo Institute reported its business climate indicator fell to 97.9 this month, missing analyst expectations and down from 99.2 the previous month. The reading is the lowest since November of 2014. In the details, much of the decline was due to a fall in business owners’ assessment of current conditions, which fell 3.4 points to 100.0. Clemens Fuest, president of the Ifo Institute stated, “The German economy is still lacking in momentum.”
China’s state news agency Xinhua reported the United States has called on China to curb its development of state-owned enterprises (SOE’s), a demand that China sees as an “invasion” of its economic sovereignty. As trade talks have stalled, both sides have appeared to be digging in. China has reiterated it would not make concessions to “matters of principles” to defend its core interests. In its commentary Xinhua stated, “At the negotiating table, the U.S. government presented a number of arrogant demands to China, including restricting the development of state-owned enterprises.” SOEs in China enjoy not only explicit subsidies but also hidden benefits such as implicit government guarantees for debts and lower interest for bank loans, analysts and trade groups say.
Japan’s government downgraded its assessment of the Japanese economy, predominantly due to the continuing China-U.S. trade dispute. Japan’s Cabinet Office wrote in its monthly report, “The Japanese economy is recovering at a moderate pace while weakness in exports and industrial production continues.” It maintained its view that the economy is seeing a moderate recovery on improving employment conditions and robust corporate earnings, but slightly changed its wording on exports and production from the previous report. The downgrading followed a lowered assessment in March, when the Cabinet Office cut the headline assessment for the first time in three years. Looking ahead, the latest report warned that “further attention should be given” to the fallout for the world economy from the U.S.-China trade war.
Finally: If you’re not sure if you are saving enough for retirement – well, you’re not alone. One might think this is a fairly simple question, but it quickly becomes quite complex – and difficult to get a concrete answer. However, one research group is willing to give an answer – the Employee Benefits Research Institute, or EBRI. The EBRI says retirement savers should follow one simple rule: put aside at least 10% of your paycheck (including any employer match). EBRI’s research showed that setting aside 10% starting at age 25 would result in an acceptably low 30% chance of running out of money in retirement. The chart below, from the Brookings Institution, shows how dramatically the chance of running out of money declines for every additional % of savings for a hypothetical 25-year old.

(sources: all index return data from Yahoo Finance; Reuters, Barron’s, Wall St Journal, Bloomberg.com, ft.com, guggenheimpartners.com, zerohedge.com, ritholtz.com, markit.com, financialpost.com, Eurostat, Statistics Canada, Yahoo! Finance, stocksandnews.com, marketwatch.com, wantchinatimes.com, BBC, 361capital.com, pensionpartners.com, cnbc.com, FactSet) These are the opinions of WE Sherman and Co and not necessarily those of Cambridge, are for informational purposes only, and should not be construed or acted upon as individualized investment advice.
Securities offered through Registered Representatives of Cambridge Investment Research Inc., a broker-dealer, member FINRA/SIPC. Advisory Services offered through Cambridge Investment Research Advisors, a Registered Investment Adviser. Strategic Investment Partners and Cambridge are not affiliated.
Indices mentioned are unmanaged and cannot be invested into directly. Past performance is no guarantee of future results. All Investing involves risk. Depending on the types of investments, there may be varying degrees of risk. Investors should be prepared to bear loss, including total loss of principal.