
6-22-20 Weekly Market Update
The very Big Picture
The long-term valuation of the market is commonly measured by the Cyclically Adjusted Price to Earnings ratio, or “CAPE”, which smooths-out shorter-term earnings swings in order to get a longer-term assessment of market valuation. A CAPE level of 30 is considered to be the upper end of the normal range, and the level at which further PE-ratio expansion comes to a halt (meaning that further increases in market prices only occur as a general response to earnings increases, instead of rising “just because”). The market was recently at that level.
Of course, a “mania” could come along and drive prices higher – much higher, even – and for some years to come. Manias occur when valuation no longer seems to matter, and caution is thrown completely to the wind – as buyers rush in to buy first, and ask questions later. Two manias in the last century – the “Roaring Twenties” of the 1920s, and the “Tech Bubble” of the late 1990s – show that the sky is the limit when common sense is overcome by a blind desire to buy. But, of course, the piper must be paid, and the following decade or two were spent in Secular Bear Markets, giving most or all of the mania-gains back.
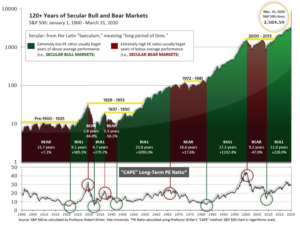
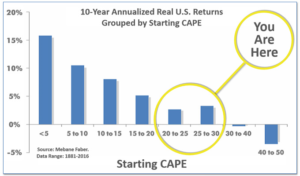
See Fig. 1 for the 100-year view of Secular Bulls and Bears. The CAPE is now at 29.05, up from the prior week’s 28.52. Since 1881, the average annual return for all ten-year periods that began with a CAPE in the 20-30 range have been slightly-positive to slightly-negative (see Fig. 2).
Note: We do not use CAPE as an official input into our methods. However, if history is any guide – and history is typically ‘some’ kind of guide – it’s always good to simply know where we are on the historic continuum, where that may lead, and what sort of expectations one may wish to hold in order to craft an investment strategy that works in any market ‘season’ … whether current one, or one that may be ‘coming soon’!
The Big Picture:
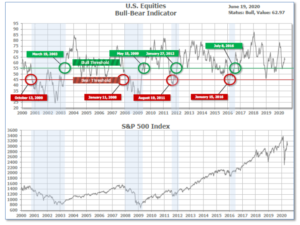
The ‘big picture’ is the (typically) years-long timeframe – the timeframe in which Cyclical Bulls and Bears operate. The U.S. Bull-Bear Indicator is in Cyclical Bull territory at 62.97 down from the prior week’s 63.23.
In the Quarterly- and Shorter-term Pictures
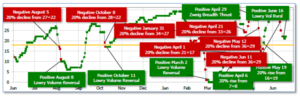
The Quarterly-Trend Indicator based on the combination of U.S. and International Equities trend-statuses at the start of each quarter – was Negative entering April, indicating negative prospects for equities in the second quarter of 2020. (On the ‘daily’ version of the Quarterly-Trend Indicator, where the intra-quarter status of the Indicator is subject to occasional change, both the U.S. Equities and International Equities readings remain in ‘Down’ status; the daily International reading turned to Down on Thursday, Feb. 27th; the U.S. daily reading turned to Down on Friday, Feb. 28th.)
Next, the short-term(weeks to months) Indicator for US Equities turned positive on June 16 and ended the week at 22, down from the prior week’s 25.
The Complete Picture:
Counting-up of the number of all our indicators that are ‘Up’ for U.S. Equities, the current tally is that three of four are Positive, representing a multitude of timeframes (two that can be solely days/weeks, or months+ at a time; another, a quarter at a time; and lastly, the {typically} years-long reading, that being the Cyclical Bull or Bear status).
In the Markets:
U.S. Markets: U.S. stocks recorded gains this week that helped erase part of the previous week’s steep declines. The technology-heavy NASDAQ Composite fared the best, almost hitting the all-time intraday high it established on June 10th. Energy and health care stocks outperformed, while the real estate and utilities sectors lagged. The Dow Jones Industrial Average rose 266 points to finish the week at 25,871, a gain of 1.0%. The NASDAQ Composite more than retraced last week’s decline, rising 3.7% to 9,946. By market cap, the large cap S&P 500 added 1.9%, while the midcap S&P 400 and small cap Russell 2000 rose 1.4% and 2.2%, respectively.
International Markets: International markets were also a sea of green following last week’s sell-off. Canada’s TSX rose 1.4% while the United Kingdom’s FTSE 100 added 3.1%. On Europe’s mainland, France’s CAC 40 rose 2.9% and Germany’s DAX gained 3.2%. In Asia, China’s Shanghai Composite rose 1.6% and Japan’s Nikkei finished up 0.8%. As grouped by Morgan Stanley Capital International, developed markets rose 1.0% while emerging markets added 0.7%.
Commodities: Precious metals also finished the week to the upside. Gold rose $15.70 to $1,753 an ounce, a gain of 0.9%. Silver added $0.36 to $17.85 an ounce, an increase of 2.1%. Oil retraced last week’s decline by rising 9.9% to $39.83 per barrel of West Texas Intermediate crude oil. The industrial metal copper, viewed by some analysts as a barometer of global economic health due to its wide variety of uses, finished the week up 0.4%–its fifth consecutive week of gains.
U.S. Economic News: The number of Americans seeking first-time unemployment benefits dipped last week, but remained stubbornly high. The Labor Department reported initial claims for unemployment insurance fell by 58,000 last week to 1.508 million, its 11th straight decline. Economists had forecast 1.35 million new claims. Continuing claims, which counts the number of Americans already receiving benefits, fell by 62,000 to 20.544 million. That number is reported with a one-week delay. Overall, about 49 million new jobless claims have been filed since the pandemic began, but, shocking as those numbers are, they don’t reveal much about how quickly the labor market is recovering. The more important figure to watch is continuing claims, and while they’ve begun to subside, they are not declining at a pace that indicates a rapid recovery in lost jobs.
Confidence among the nation’s home builders rebounded as the real estate market continued to show signs of recovery. The National Association of Home Builders’ (NAHB) monthly confidence index rose 21 points to a reading of 58 in June, the trade group reported. It’s a marked rebound from April, when the index fell to its lowest level since June 2012. “Inventory is tight, mortgage applications are increasing, interest rates are low and confidence is rising,” said Dean Mon, chairman of the NAHB. “And buyer traffic more than doubled in one month even as builders report growing online and phone inquiries stemming from the outbreak.” Index readings above 50 indicate improving confidence, while a figure below that threshold would signal the opposite. April was the first time since 2014 that the index has dropped below 50.
Construction of new houses rose 4.3% last month as ultra-low mortgage rates and a re-opening economy drew more buyers into the housing market. The Commerce Department reported housing starts climbed to an annual rate of 974,000 last month. That is a significant improvement from the five-year low of 934,000 seen in April. However the reading missed economists’ forecasts of starts to rise to a 1.13 million annual rate. Although the increase was less than expected, a sharp rise in builder permits indicates construction is on track to expand more rapidly in the near future. Permits to build new houses jumped 14.4 % to a 1.22 million annual pace.
Manufacturing activity in the New York region increased by a record amount in June, well above expectations. The New York Fed reported its Empire State General Business Conditions Index increased 48.3 points to a reading of -0.2. Economists had expected a reading of -35.0. It shows factory activity in the region has stabilized, following the record slump at the peak of the pandemic. The report is the first of six regional factory activity indexes and likely a harbinger of improving conditions across the country. In the details of the report, the New Orders and Shipments indexes both bounced back from deeply negative territory and posting close to flat readings. Just as impressive was the surge in optimism, as the Expectations Index jumped 27.4 points to 56.5—its highest reading since October of 2009.
A similar report from the Philadelphia Fed also showed improving conditions. The Philly Fed’s regional business conditions index surged a record 70.6 points to 27.5 in June from a negative 43.1 the prior month. Economists had only expected a rebound to -20. The index reached positive territory for the first time since February as factory activity in the region resumed following shutdowns. Nearly all individual activity indexes returned to growth mode, led by record or near-record jumps in new orders and shipments. Employment indicators continued to decline, but at slower rate. The Future Activity Index rose 16.6 points to 66.3, its highest level since June 1992.
Sales at U.S. retailers surged to a new record last month, but the after-effects of the coronavirus continue to linger. The Commerce Department reported retail sales jumped a record 17.7% last month. Economists had forecast just a 7.7% increase. Sales had tumbled by a record 14.7% in April and 8.2% in March as the coronavirus pandemic spread across the country. The rebound in sales largely reflects the loosening of restrictions on business activity after two months of stay-at-home orders to combat the spread. Yet, despite the rebound, sales were still 6% lower than at the same time last year.
Federal Reserve Chairman Jerome Powell was quick to point out that investors shouldn’t overreact to surprisingly good economic data like the May retail sales report. In testimony to the Senate Banking Committee, Powell acknowledged some economic indicators have pointed to stabilization in activity and others have even suggested “a modest rebound.” “The levels of output and employment remain far below their pre-pandemic levels, and significant uncertainty remains about the timing and strength of the recovery,” Powell said. The Fed chairman added that until the coronavirus disease is contained, a full recovery is unlikely.
International Economic News: Chief economists at Canada’s major banks told the House of Commons Finance Committee that the Canadian economy is showing signs of growth and is poised for a sharp recovery as provincial governments gradually lift their restrictions. Douglas Porter, chief economist at BMO Bank of Montreal stated, “Canada has just experienced the deepest, sharpest economic downturn in the post-war era, but it also now looks to have been the shortest recession ever as well.” Their comments come as improved labor and consumer spending data provided at least some room for optimism on the Canadian economy. Canada’s federal budget watchdog posted a “significant” update to its economic outlook for Canada, estimating a much smaller contraction in GDP than it projected in April.
Across the Atlantic, the Bank of England announced a new stimulus package for the United Kingdom’s economy as it works to stave off its worst downturn in more than 300 years. The central bank’s Monetary Policy Committee (MPC) said Thursday that it would increase its bond-buying program by another £100 billion ($125 billion), bringing the total up to £745 billion ($929 billion). The Bank of England’s purchases of government bonds are helping the UK government to finance recovery efforts as it borrows record amounts. The MPC said some of the increase in activity after the Covid-19 shutdown was taking place in the current quarter, rather than in the July to September period. It now expects the economy to contract by 20% in the first half of the year rather than 27% it had previously estimated.
The official statistics agency of France, INSEE, said the French economy would shrink less than expected in the second quarter as business activity began recovering in May. INSEE said the Eurozone’s second-biggest economy should contract 17% in the second quarter after a previous forecast last month expected a larger 20% contraction. The agency estimated that the economy was running at 22% below normal levels after the lockdown, imposed in mid-March, was eased in mid-May. Activity was down as much as 33% in April. For June, INSEE predicted economic activity would be 12% below normal levels. The agency said April would remain the worst-ever month the French economy has seen in peace-time since records began.
A survey of German investors showed they were confident the worst of Germany’s sharp economic downturn linked to the coronavirus pandemic will be over by the end of summer. The ZEW research institute said its monthly survey showed investor sentiment rose to 63.4 in June from 51.0 in May. Economists had expected a reading of 60.0. “There is growing confidence that the economy will bottom out by (the end of) summer 2020,” ZEW President Achim Wambach said in a statement. A robust health care system and widespread testing has helped Germany record fewer fatalities linked to COVID-19 than many other European countries. Even so, Europe’s largest economy is facing its worst recession since World War Two, with the government predicting in April that gross domestic product would shrink 6.3% this year.
In Asia, industrial production in China rose last month along with several other economic indicators. The automobile market has seen a fast recovery in post-lockdown China, with sales hitting 2.19 million units in May, up 14.5% from the same time last year. Furthermore, Michelin’s three Chinese factories have all resumed production, and Michelin’s business performance in China is expected to meet its June projections. As China’s passenger transport and logistics rebounded with the steady resumption of business activities, its oil market is also on a track to recovery. Jim Burkhard, vice president and head of oil markets at IHS Markit took “the brisk resumption of Chinese oil demand” as “a welcome signpost for the global economy.”
Japan’s economy almost ceased to decline as it began its reopening following the complete lifting of its pandemic restrictions, the government said in its monthly economic report for June. The government, which said the economy was “worsening rapidly” in its May report, revised its monthly assessment upward for the first time since January 2018. “The Japanese economy is still in an extremely severe situation due to the novel coronavirus, but it almost stopped deteriorating,” the Cabinet Office said. Out of 11 main components of the assessment, the government revised upward its view of private consumption and corporate judgments of business conditions.
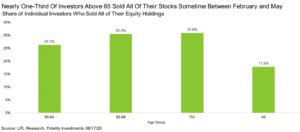
Finally: As the coronavirus spread across the nation, fear of its deadly effects hit unprecedented levels. That fear naturally carried over to the stock market where nearly a third of all investors 65 years old and older sold their entire equity holdings. According to data from Fidelity Investments, nearly 18% of all investors sold their entire equity holdings between February and May. However, for those aged 65 and older, that percentage was nearly double at over 30%. With stocks back near their highs, LPL Financial senior market strategist Ryan Detrick noted, “this is yet another reason to have a plan in place before trouble comes, as making decisions when under duress frequently leads to the exact wrong decision.”
(Sources: All index- and returns-data from Yahoo Finance; news from Reuters, Barron’s, Wall St. Journal, Bloomberg.com, ft.com, guggenheimpartners.com, zerohedge.com, ritholtz.com, markit.com, financialpost.com, Eurostat, Statistics Canada, Yahoo! Finance, stocksandnews.com, marketwatch.com, wantchinatimes.com, BBC, 361capital.com, pensionpartners.com, cnbc.com, FactSet.) Securities offered through Registered Representatives of Cambridge Investment Research Inc., a broker-dealer, member FINRA/SIPC. Advisory Services offered through Cambridge Investment Research Advisors, a Registered Investment Adviser. Strategic Investment Partners and Cambridge are not affiliated. Indices mentioned are unmanaged and cannot be invested into directly. Past performance is no guarantee of future results.