
6-26-2023 Weekly Market Update
The very Big Picture
The long-term valuation of the market is commonly measured by the Cyclically Adjusted Price to Earnings ratio, or “CAPE”, which smooths-out shorter-term earnings swings in order to get a longer-term assessment of market valuation. A CAPE level of 30 is considered to be the upper end of the normal range, and the level at which further PE-ratio expansion comes to a halt (meaning that further increases in market prices only occur as a general response to earnings increases, instead of rising “just because”). The market was recently above that level and has fallen back.
Of course, a “mania” could come along and drive prices higher – much higher, even – and for some years to come. Manias occur when valuation no longer seems to matter, and caution is thrown completely to the wind – as buyers rush in to buy first, and ask questions later. Two manias in the last century – the “Roaring Twenties” of the 1920s, and the “Tech Bubble” of the late 1990s – show that the sky is the limit when common sense is overcome by a blind desire to buy. But, of course, the piper must be paid, and the following decade or two were spent in Secular Bear Markets, giving most or all of the mania-gains back.
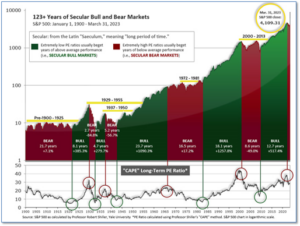
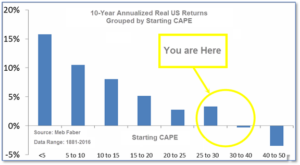
See Fig. 1 for the 100-year view of Secular Bulls and Bears. The CAPE is now at 30.35, down from the prior week’s 30.78. Since 1881, the average annual return for all ten-year periods that began with a CAPE in this range has been slightly positive to slightly negative (see Fig. 2).
Note: We do not use CAPE as an official input into our methods. However, if history is any guide – and history is typically ‘some’ kind of guide – it’s always good to simply know where we are on the historic continuum, where that may lead, and what sort of expectations one may wish to hold in order to craft an investment strategy that works in any market ‘season’ … whether the current one, or one that may be ‘coming soon’!
The Big Picture:
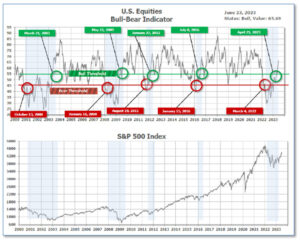
The ‘big picture’ is the (typically) years-long timeframe – the timeframe in which Cyclical Bulls and Bears operate. The U.S. Bull-Bear Indicator finished the week in Bull territory at 65.69, down from the prior week’s 66.41. (see Fig. 3)
In the Quarterly- and Shorter-term Pictures
The Quarterly-Trend Indicator based on the combination of U.S. and International Equities trend-statuses at the start of each quarter – was Positive entering April, indicating positive prospects for equities in the second quarter.
Next, the short-term(weeks to months) Indicator for US Equities turned positive on May 25, and ended the week at 30, unchanged from the prior week.

In the Markets:
U.S. Markets: The major benchmarks closed lower in a holiday-shortened week. The Nasdaq Composite suffered its first weekly decline in two months, while the S&P 500 Index recorded its first drop in six weeks. Growth stocks outperformed value shares, while large-caps fared better than small-caps. The Dow Jones Industrial Average shed 572 points last week closing at 33,727, a decline of -1.7%. The technology-heavy Nasdaq Composite finished the week down -1.4%. By market cap, the large cap S&P 500 retreated -1.4%, while the mid-cap S&P 400 fell -2.5%. The small-cap Russell 2000 fared the worst giving up -2.9%.
International Markets: International markets finished the week predominantly to the downside as well. Canada’s TSX fell -2.8% while the United Kingdom’s FTSE 100 declined -2.4%. France’s CAC 40 and Germany’s DAX gave up -3% and -3.2% respectively, while in Asia China’s Shanghai Composite declined -2.3%. Japan’s Nikkei had its first down week in the last eleven, falling -2.7%. As grouped by Morgan Stanley Capital International, developed markets fell -3.3%, while emerging markets shed -4.2%.
Commodities: Gold and Silver finished the week mixed, Gold rose 0.3% to $1929.60 per ounce, while Silver retreated -0.5% to $22.35. The industrial metal copper, viewed by some analysts as a barometer of world economic health due to its wide variety of uses, ended the week down -2.2%. Oil retreated as well–West Texas Intermediate crude finished the week down -0.5% to $69.16 per barrel.
U.S. Economic News: The number of Americans who applied for first-time unemployment benefits last week remained flat at 264,000, leaving it at a nearly two-year high and possibly signaling some decay in the U.S. labor market. California, Connecticut and New Jersey were the only states to post sizable increases, however. New claims fell in most other states. Unemployment claims typically rise when the economy weakens and a recession approaches. They’ve increased since the beginning of the year but are still quite low. Meanwhile, the number of people already collecting benefits dipped by 13,000 to 1.78 million. The apparent disconnect between weekly claims data and continuing claims has analysts puzzled. “The diverging momentum in initial claims and continuing claims raises the obvious question about which data is telling the right story, and how long can this condition persist,” said Thomas Simons, U.S. economist at Jefferies.
For the first time in nearly a year, home builders turned bullish amid strong demand. The National Association of Home Builders’ (NAHB) monthly confidence index rose 5 points to 55 in June, the trade group said. This is the sixth month in a row that sentiment has improved among builders. It is also the first time in 11 months that builder confidence has moved into positive territory of above 50. The shortage of previously-owned homes is helping to buoy builders’ confidence. With mortgage rates above 6%, many homeowners find little incentive to sell—nearly 92% have an outstanding mortgage with a rate below 6%, according to a recent survey conducted by Redfin. Furthermore, 23.5% of homeowners have a mortgage rate of less than 3%. Consequently, the number of new home listings has dropped by 22% compared with the same period a year ago, according to Realtor.com.
The National Association of Realtors reported sales of previously-owned homes rose slightly last month amid a shortage of homes for sale and higher mortgage rates. Sales of existing homes increased 0.2% to an annual rate of 4.3 million in May. The rise exceeded expectations. However, compared with the same time last year, sales were down 20.4%. In addition, the median price for an existing home fell 3.1% to $396,100. The drop is the largest since December of 2011 when home prices dropped 3.9%. There were 1.08 million units on the market in the month of May—the lowest number of homes, particularly single-family homes, that have been on the market in May since the NAR began tracking data in 1983.
Federal Reserve Chair Jerome Powell told Congress that with U.S. inflation well above target more interest rates are likely this year. However, he did not shed any new light on the timing of the moves. “Nearly all FOMC participants expect that it will be appropriate to raise interest rates somewhat further by the end of the year,” Powell said, in testimony to the House Financial Service Committee. “We will continue to make our decisions meeting by meeting, based on the totality of incoming data and their implications for the outlook for economic activity and inflation, as well as the balance of risks,” Powell said. Last week the Fed released updated forecasts that showed 12 of 18 policymakers expect two more 25 basis point rate hikes this year. That would bring the Fed’s benchmark interest rate to a range of 5.5%-5.75%.
The Conference Board reported its Leading Economic Index (LEI) fell for a 14th month in a row and continued to signal an impending recession. The LEI dropped 0.7% in May matching economists’ forecasts. The leading economic index is a gauge of 10 indicators designed to show whether the economy is getting better or worse. While the leading index has been signaling a recession for months, senior Fed officials caution the pandemic has upended old economic models. The economy might not react as it has historically. Justyna Zabinska-La Monica, senior manager of business cycle indicators at the board stated, “While we revised our [second quarter] GDP forecast from negative to slight growth, we project that the U.S. economy will contract” from the third quarter of 2023 through the first three months of 2024.
International Economic News: Canada’s biggest banks will be required to set aside more money to cover possible losses as fears of an economic downturn continue to grow. The Office of the Superintendent of Financial Institutions (OSFI), which regulates Canada’s biggest lenders, announced it would raise the domestic stability buffer (DSB) to 3.5 per cent, up from 3.0 per cent. The change will take effect Nov. 1, 2023. This marks the buffer’s highest level since its inception in June 2018. The DSB dictates how much of a bank’s reserve funds must be set aside to cover possible losses. The DSB is one part of an overall capital requirement that big banks must hold at all times. With the recent hike, the minimum amount banks must have on-hand will rise to 11.5 per cent of their total assets.
Inflation in the United Kingdom held steady at 8.7% in May, prompting the Bank of England to raise its key interest rate half a percentage point. The data released by the Office for National Statistics defied forecasts for a slowdown in inflation to 8.4% compared with the same time last year. Core inflation — which strips out volatile food and energy costs and is viewed by some analysts as a better gauge of the underlying trend in prices — rose last month, hitting a 31-year high of 7.1%. The Bank of England’s decision in favor of a 13th consecutive hike takes the main borrowing cost for commercial banks in the United Kingdom to 5%, the highest since April 2008.
French Finance Minister Bruno Le Maire said this week he was sticking for now with the government’s forecast of 1% economic growth for 2023. “I am lucid about the economic environment with several of our neighbors in recession…so we will keep on monitoring the situation closely,” he added. French statistic institute INSEE said earlier this month that the euro zone’s second biggest economy is projected to expand by 0.1% in the third quarter and 0.2% in the fourth, making for an annual GDP figure of 0.6%.
The German economy shrank unexpectedly in the first three months of this year, marking the second quarter of contraction that is one definition of recession. Data released by the Federal Statistical Office shows Germany’s gross domestic product, or GDP, declined by 0.3% in the period from January to March. This follows a drop of 0.5% in Europe’s biggest economy during the last quarter of 2022. “Employment in the country rose in the first quarter and inflation has eased, but higher interest rates will keep weighing on spending and investment”, said Franziska Palmas, senior Europe economist for Capital Economics. “Germany has experienced a technical recession and has been by far the worst performer among major eurozone economies over the past two quarters,” Palmas added, predicting further weakness ahead.
Secretary of State Antony Blinken underscored the importance of the economic aspects of the bilateral U.S.-China relationship during his trip to Beijing earlier this week. Blinken noted record high trade between the two countries, and said the U.S. is “prepared to cooperate with China” in “macroeconomic stability,” among other areas of mutual interest. Blinken’s visit was the first by a U.S. Secretary of State since 2018. Gabriel Wildau, managing director at consulting firm Teneo, said the most important economic takeaway from Blinken’s trip was simply that it happened. “The big fear for investors has been that bilateral relations are on an unstoppable downward spiral,” he said.
Business morale at big Japanese manufacturers ticked up in June, staying in positive territory for a second straight month, a Reuters poll showed. Furthermore, Japan’s services sector index hovered near recent highs bolstering views that strong domestic demand may offset a slowdown in exports—a rare occurrence for Japan’s export-reliant economy. The monthly poll suggested there would be a steady recovery in business sentiment in the Bank of Japan’s (BOJ) closely watched tankan quarterly survey due next on July 3.
Finally: Is the ESG investing boom already over? After peaking at $17.1 trillion in 2020, ESG assets in the United States dropped sharply to just $8.4 trillion in 2022. ESG, which stands for Environmental, Social, and Governance investing, emerged as one of the biggest investment trends in modern times. This year, four ETFs focusing on ESG have been liquidated while their surviving peers continue to record capital outflows. Talking points around ESG have dwindled as well. According to Factset, just 74 companies in the S&P 500 cited the term “ESG” during their latest conference call transcripts—less than half the 156 times the term was used in the fourth quarter of 2021.

(Sources: All index- and returns-data from Norgate Data and Commodity Systems Incorporated; news from Reuters, Barron’s, Wall St. Journal, Bloomberg.com, ft.com, guggenheimpartners.com, zerohedge.com, ritholtz.com, markit.com, financialpost.com, Eurostat, Statistics Canada, Yahoo! Finance, stocksandnews.com, marketwatch.com, wantchinatimes.com, BBC, 361capital.com, pensionpartners.com, cnbc.com, FactSet.) Content provided by WE Sherman and Company. Securities offered through Registered Representatives of Cambridge Investment Research Inc., a broker-dealer, member FINRA/SIPC. Advisory Services offered through Cambridge Investment Research Advisors, a Registered Investment Adviser. Strategic Investment Partners and Cambridge are not affiliated. Indices mentioned are unmanaged and cannot be invested into directly. Past performance is no guarantee of future results. These opinions of Strategic Investment Partners and not necessarily those of Cambridge Investment Research, are for informational purposes only and should not be construed or acted upon as individualized investment advice.