
6-15-20 Weekly Market Update
The very Big Picture
The long-term valuation of the market is commonly measured by the Cyclically Adjusted Price to Earnings ratio, or “CAPE”, which smooths-out shorter-term earnings swings in order to get a longer-term assessment of market valuation. A CAPE level of 30 is considered to be the upper end of the normal range, and the level at which further PE-ratio expansion comes to a halt (meaning that further increases in market prices only occur as a general response to earnings increases, instead of rising “just because”). The market was recently at that level.
Of course, a “mania” could come along and drive prices higher – much higher, even – and for some years to come. Manias occur when valuation no longer seems to matter, and caution is thrown completely to the wind – as buyers rush in to buy first, and ask questions later. Two manias in the last century – the “Roaring Twenties” of the 1920s, and the “Tech Bubble” of the late 1990s – show that the sky is the limit when common sense is overcome by a blind desire to buy. But, of course, the piper must be paid, and the following decade or two were spent in Secular Bear Markets, giving most or all of the mania-gains back.
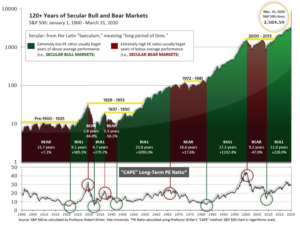
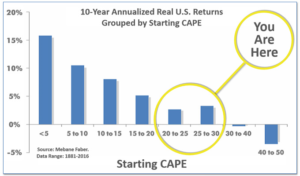
See Fig. 1 for the 100-year view of Secular Bulls and Bears. The CAPE is now at 28.52, down from the prior week’s 29.95. Since 1881, the average annual return for all ten-year periods that began with a CAPE in the 20-30 range have been slightly-positive to slightly-negative (see Fig. 2).
Note: We do not use CAPE as an official input into our methods. However, if history is any guide – and history is typically ‘some’ kind of guide – it’s always good to simply know where we are on the historic continuum, where that may lead, and what sort of expectations one may wish to hold in order to craft an investment strategy that works in any market ‘season’ … whether current one, or one that may be ‘coming soon’!
The Big Picture:
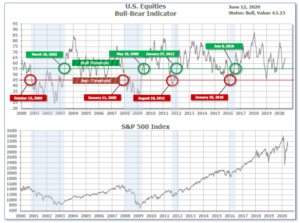
The ‘big picture’ is the (typically) years-long timeframe – the timeframe in which Cyclical Bulls and Bears operate. The U.S. Bull-Bear Indicator is in Cyclical Bull territory at 63.23 down from the prior week’s 64.69.
In the Quarterly- and Shorter-term Pictures
The Quarterly-Trend Indicator based on the combination of U.S. and International Equities trend-statuses at the start of each quarter – was Negative entering April, indicating negative prospects for equities in the second quarter of 2020. (On the ‘daily’ version of the Quarterly-Trend Indicator, where the intra-quarter status of the Indicator is subject to occasional change, both the U.S. Equities and International Equities readings remain in ‘Down’ status; the daily International reading turned to Down on Thursday, Feb. 27th; the U.S. daily reading turned to Down on Friday, Feb. 28th.)
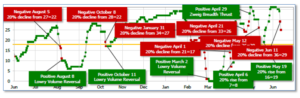
Next, the short-term(weeks to months) Indicator for US Equities turned negative on June 11 and ended the week at 25, down from the prior week’s 36.
The complete Picture:
Counting-up of the number of all our indicators that are ‘Up’ for U.S. Equities, the current tally is that two of four are Positive, representing a multitude of timeframes (two that can be solely days/weeks, or months+ at a time; another, a quarter at a time; and lastly, the {typically} years-long reading, that being the Cyclical Bull or Bear status).
In the Markets:
U.S. Markets: U.S. stocks suffered their worst weekly decline in almost three months as investors took profits from recent gains and responded to elevated worries of a second wave of COVID-19 cases. The concerns dampened the optimism surrounding the reopening which had been a key catalyst driving the big rally off of the March lows. Slower-growing value stocks surrendered their recent market leadership and recorded the steepest drops while smaller-cap shares also underperformed. The Dow Jones Industrial Average dropped over 1500 points to finish the week at 25,606, a decline of -5.6%. The technology-heavy NASDAQ Composite fared best among the indexes, giving up -2.3%. By market cap, the large cap S&P 500 declined -4.8%, while the mid-cap S&P 400 and small-cap Russell 2000 each declined -7.9%.
International Markets: International markets finished the week to the downside as well. Canada’s TSX fell -3.8%, while the United Kingdom’s FTSE declined -5.8%. On Europe’s mainland, France’s CAC 40 and Germany’s DAX retreated -6.9% and -7.0%, respectively. In Asia, China’s Shanghai Composite ticked down just -0.4%, while Japan’s Nikkei ended down ‑2.4%. As grouped by Morgan Stanley Capital International, developed markets fell -3.9%, while emerging markets gave up -2.6%.
Commodities: Gold added $54.30 an ounce finishing the week t $1737.30, a gain of 3.2%. Silver ticked up, but just +0.02% to $17.48 an ounce. After six weeks of solid gains, oil retreated -8.3% to $36.26 per barrel of West Texas Intermediate crude. The industrial metal copper, viewed by some analysts as a barometer of global economic health due to its wide variety of uses, rose for a fourth week, gaining 1.7%.
U.S. Economic News: The number of Americans applying for first-time unemployment benefits declined for a tenth week in a row as the labor market continued to recover. The Labor Department reported 1.54 million Americans applied for jobless benefits last week. Economists had expected 1.6 million new claims to be filed. The number of new applications has continued to decline since peaking at almost 7 million in late March, but they remain at a very high level. New claims had averaged around 200,000 at the beginning of the year—a 50-year low. Continuing claims, which counts the number of people already receiving benefits, also declined falling 355,000 to 1.542 million. That number is reported with a one-week delay.
The number of job openings during the first full month of the coronavirus pandemic fell to their lowest level in more than five years, according to a recent survey from the Labor Department. The government’s “Job Openings and Labor Turnover Survey” (JOLTS) showed total job vacancies plunged to just 5.05 million in April—the lowest total since December 2014. That number was a down a million from March and a 28% tumble from February’s 7.3 million. On a brighter note, total job separations fell sharply from 14.6 million in March to 9.9 million as some parts of the economy began to reopen. The number of hires totaled 3.5 million, led by trade, transportation, and utilities.
Small-business owners turned more optimistic about the economy last month expecting that the coronavirus-induced recession will be “short-lived”, according to a closely followed survey. The National Federation of Independent Business (NFIB) reported the optimism of small companies rose 3.5 points last month to 94.4. The increase was a surprise at double the consensus forecast. The index had tumbled in March by the most on record as the pandemic slammed the economy and, in particular, small businesses. While last month’s reading showed an improvement, the overall outlook remained uncertain. The NFIB’s chief economist Bill Dunkelberg stated, “It’s still uncertain when consumers will feel comfortable returning to small businesses and begin spending again, but owners are taking the necessary precautions to reopen safely.”
The prices of goods and services at the consumer level continued to decline in May as the pandemic and the resultant recession weighed on consumer demand and prices. The Bureau of Labor Statistics reported the Consumer Price Index (CPI) fell 0.1% last month, its third consecutive decline. The consensus was for an unchanged reading. Of note, food prices rose 0.7% after an even bigger 1.5% gain the previous month. It was the biggest two-month jump in food prices since February 1990. In contrast, energy prices fell -1.8%, led by cheaper gasoline and electricity prices. From the same time last year, CPI slid to just +0.1%. Core CPI, which excludes the volatile food and energy categories, eased to an annual rate of 1.2%–its lowest reading since March 2011. The readings show inflation pressures slumped during the pandemic, falling further below the Fed’s inflation target of 2.0%. This gives the Fed plenty of room for continued monetary accommodation to ease the economic damage from the recession.
Prices at the producer level rose last month led again by food. The Producer Price Index (PPI) for final demand rose 0.4% in May, its first increase in four months. Economists had expected an unchanged reading. The spike in food prices was the result of supply chain disruptions caused by the spread of COVID-19 in food processing plants. In contrast, the services PPI fell -0.2%, led by lower trade margins. Core PPI, ex-food and energy, was down -0.1% matching the consensus. Year-over-year, PPI for final demand fell -0.8%, but the pace of the decline moderated versus the prior month.
The Federal Reserve maintained a firmly dovish stance this week despite some tentative signs that the economy may have bottomed. In statements this week the Fed said it didn’t expect to lift its benchmark interest rate until 2023. Furthermore, only two of the seventeen officials anticipated rates would move higher in 2022. “We’re not even thinking about thinking about raising rates,” Fed Chairman Jerome Powell told reporters. The Fed also announced it would end the steady tapering of its asset purchases. Going forward, the Fed would keep buying Treasuries and mortgage-backed securities, “at least at the current pace.” There had been concerns among some economists and analysts that these purchases, which the Fed instituted to support market functioning, might end as they have been tapered in recent weeks. At the moment, the Fed is purchasing $20 billion in Treasuries each week and up to $22.5 billion in mortgage bonds to stimulate the economy through quantitative easing.
International Economic News: A key measure of household debt in Canada rose in the first quarter as the COVID-19 pandemic took hold, Statistics Canada reported. The agency said household credit market debt as a proportion of household disposable income rose 1.3% to 176.9%. In other words, there was $1.77 in credit market debt for every dollar in household disposable income. Priscilla Thiagamoorthy, economist at BMO, stated well before the pandemic hit that household debt was a key vulnerability in Canada’s economy. “With the economic downturn deeply impacting income growth and low rates enticing borrowing, the debt ratios will likely hit fresh record highs in the coming quarters, leaving households even more indebted,” Thiagamoorthy wrote in a report.
Across the Atlantic, the United Kingdom’s economy suffered a record 20.4% contraction in its gross domestic product in April due to the containment measures enacted to limit the spread of the coronavirus. The UK’s Office of National Statistics (ONS) said the reading was the largest drop ever recorded and followed a 5.8% drop in March. Lockdown measures “dramatically reduced economic activity”, the ONS stated, adding that the most significant one was “the introduction of restrictions in movement across the UK”, which began on March 23. The UK has been Europe’s worst-hit country, accounting for over 41,000 deaths and nearly 293,000 COVID-19 cases, according to Johns Hopkins Coronavirus Resource Center.
On Europe’s mainland, the Bank of France predicted the French economy will shrink about 10% this year due to the coronavirus pandemic. Furthermore, the central bank stated growth won’t return to pre-crisis levels until mid-2022. The bank said signs of a “progressive” recovery should become apparent in the third quarter of this year and then expand 7% in 2021 followed by a further 4% in 2022. Unemployment is likely to hit highs above 11.5% in mid-2021, it added. The central bank said the outlook could be brighter if the COVID-19 outbreak is quickly brought under control. President Emmanuel Macron put France under one of the most stringent lockdowns in Europe in mid-March, effectively shutting down large swaths of the economy until restrictions began to be lifted on May 11.
Germany’s economy had its “worst month ever” at the height of the lockdown, Germany’s statistics office Destatis reported. Germany’s industrial production fell by 17.9% in April, marking the data series’ largest decline since the series began in January 1991. The sharpest drop in production was seen in the auto industry which recorded a 74.6% month-over-month decline. Compared to the same month in 2019, industrial production declined by 25.3%. The data from Germany comes despite the country having a far less severe epidemic than its western European peers. While the overall number of cases has been similar to its neighbors, its death toll has been less than a third. Germany has reported 8,685 deaths, while France has recorded 29,158 deaths.
China’s economic recovery is “going to look very impressive”, according to the chief economist at Deutsche Bank. Michael Spencer, head of research for Asia Pacific, said improving domestic demand in China is expected to help the economy grow by 5-6% in the second quarter, following a contraction in the first. Spencer said “a broad range of indicators” — such as auto and property sales — are “returning to normal” in China. The country’s exports have also been better than expected. However, according to Spencer, the biggest risk to the Chinese—and global—economy is the U.S. The U.S. is reopening “too soon,” according to Spencer, which could trigger another wave of coronavirus infections and further rounds of lockdown, he added.
Japan’s economy contracted at a relatively mild 2.2% annualized pace in the first quarter, the government announced this week—a much smaller decline than the preliminary estimate of 3.4%. Despite the upward revision, Japan remains in a technical recession — at least two consecutive quarters of negative growth — for the first time since 2015. The coronavirus began impacting the figures during the first quarter, when Japan’s economy was already sluggish due to a consumption tax increase that took place in October. The outlook for the current quarter is gloomy due to stay-at-home and business closure requests that began in March and remain in place. According to a survey of 33 economists released last month by the Japan Center for Economic Research, Japan’s economy is expected to contract 21.3% in the current quarter.
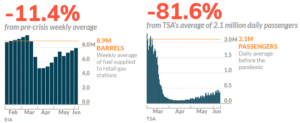
Finally: If it seems like there are a lot more cars on the road now than there were just a few weeks ago, you’re not mistaken. The Energy Information Administration (EIA) reported weekly fuel deliveries to retail gas stations have recovered to 88.6% of pre-coronavirus levels. After hitting a low of 5.1 million barrels of fuel in the first week of April, fuel deliveries last week rose to 7.9 million. Evidently, some of those cars are carrying people to destinations to which they previously would have flown: the Transportation Security Administration (TSA) reports that air travel through the first week of June remains down a whopping ‑81.6% from pre-coronavirus levels.
(Sources: All index- and returns-data from Yahoo Finance; news from Reuters, Barron’s, Wall St. Journal, Bloomberg.com, ft.com, guggenheimpartners.com, zerohedge.com, ritholtz.com, markit.com, financialpost.com, Eurostat, Statistics Canada, Yahoo! Finance, stocksandnews.com, marketwatch.com, wantchinatimes.com, BBC, 361capital.com, pensionpartners.com, cnbc.com, FactSet.) Securities offered through Registered Representatives of Cambridge Investment Research Inc., a broker-dealer, member FINRA/SIPC. Advisory Services offered through Cambridge Investment Research Advisors, a Registered Investment Adviser. Strategic Investment Partners and Cambridge are not affiliated. Indices mentioned are unmanaged and cannot be invested into directly. Past performance is no guarantee of future results.