6-8-20 Weekly Market Update
The very Big Picture
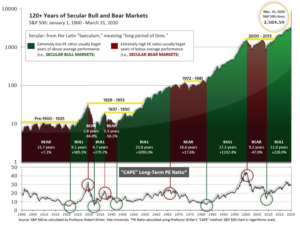
The long-term valuation of the market is commonly measured by the Cyclically Adjusted Price to Earnings ratio, or “CAPE”, which smooths-out shorter-term earnings swings in order to get a longer-term assessment of market valuation. A CAPE level of 30 is considered to be the upper end of the normal range, and the level at which further PE-ratio expansion comes to a halt (meaning that further increases in market prices only occur as a general response to earnings increases, instead of rising “just because”). The market was recently at that level.
Of course, a “mania” could come along and drive prices higher – much higher, even – and for some years to come. Manias occur when valuation no longer seems to matter, and caution is thrown completely to the wind – as buyers rush in to buy first, and ask questions later. Two manias in the last century – the “Roaring Twenties” of the 1920s, and the “Tech Bubble” of the late 1990s – show that the sky is the limit when common sense is overcome by a blind desire to buy. But, of course, the piper must be paid, and the following decade or two were spent in Secular Bear Markets, giving most or all of the mania-gains back.

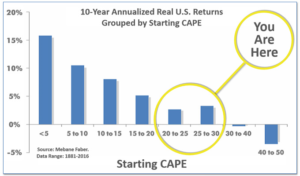
See above for the 100-year view of Secular Bulls and Bears. The CAPE is now at 29.95, up from the prior week’s 28.62 and now essentially back to 30. Since 1881, the average annual return for all ten-year periods that began with a CAPE in the 20-30 range have been slightly-positive to slightly-negative (see Fig. 2).

Note: We do not use CAPE as an official input into our methods. However, if history is any guide – and history is typically ‘some’ kind of guide – it’s always good to simply know where we are on the historic continuum, where that may lead, and what sort of expectations one may wish to hold in order to craft an investment strategy that works in any market ‘season’ … whether current one, or one that may be ‘coming soon’!
The Big Picture:
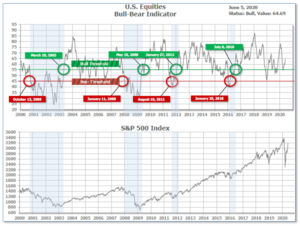
The ‘big picture’ is the (typically) years-long timeframe – the timeframe in which Cyclical Bulls and Bears operate. The U.S. Bull-Bear Indicator is in Cyclical Bull territory at 64.69 up from the prior week’s 62.54.

In the Quarterly- and Shorter-term Pictures
The Quarterly-Trend Indicator based on the combination of U.S. and International Equities trend-statuses at the start of each quarter – was Negative entering April, indicating negative prospects for equities in the second quarter of 2020. (On the ‘daily’ version of the Quarterly-Trend Indicator, where the intra-quarter status of the Indicator is subject to occasional change, both the U.S. Equities and International Equities readings remain in ‘Down’ status; the daily International reading turned to Down on Thursday, Feb. 27th; the U.S. daily reading turned to Down on Friday, Feb. 28th.)
Next, the short-term(weeks to months) Indicator for US Equities is positive and ended the week at 36, unchanged from the prior week at 36.

The Complete Picture:
Counting-up of the number of all our indicators that are ‘Up’ for U.S. Equities (see Fig. 3), the current tally is that three of four are Positive, representing a multitude of timeframes (two that can be solely days/weeks, or months+ at a time; another, a quarter at a time; and lastly, the {typically} years-long reading, that being the Cyclical Bull or Bear status).
In the Markets:
U.S. Markets: U.S. stocks recorded their best weekly gain in two months as investors celebrated signs of the beginning of an economic recovery. The Dow Jones Industrial Average added 1,728 points to close at 27,111, a gain of 6.8%. The technology-heavy NASDAQ Composite established an intra-day all-time high before pulling back but still finishing up 3.4%. The large cap S&P 500 rose for a third consecutive week gaining 4.9%. The smaller-cap indexes were particularly strong with the small cap Russell 2000 and mid cap S&P 400 surging 8.1% and 8.3%, respectively. Value stocks outperformed growth shares by a wide margin.
International Markets: The rally was global, with all major indexes finishing the week in the green. Canada’s TSX rose 4.4%, while the United Kingdom’s FTSE 100 added 6.7%. France’s CAC 40 and Germany’s DAX gained 10.7% and 10.9%, respectively. In Asia, China’s Shanghai Composite finished up 2.8% and Japan’s Nikkei added 4.5%. As grouped by Morgan Stanley Capital International, developed markets finished the week up 7.0%, while emerging markets surged a whopping 8.5%.
Commodities: Precious metals sold off in the face of strength in the equities markets. Gold retreated -3.9% to $1683 per ounce, while the often more volatile Silver gave up -5.5% to $17.48 per ounce. Oil rallied for a sixth consecutive week surging 11.4% to $39.55 per barrel of West Texas Intermediate crude. The industrial metal copper, viewed by some analysts as a barometer of global economic health due to its wide variety of industrial uses, rose for a third consecutive week by gaining 5.4%.
U.S. Economic News: The number of Americans seeking first-time unemployment benefits fell for a ninth consecutive week last week to 1.877 million. Economists had expected a reading of 1.8 million. While readings continued to decline they still remain far above the average 200-300,000 weekly readings from the beginning of the year. This suggests that while the labor market is recovering as state economies gradually reopen, it is still far from the pre-pandemic normal. Continuing claims, which counts the number of Americans already receiving benefits, increased by 437,000 to 19.3 million based on unadjusted figures from the Bureau of Labor Statistics. That number is reported with a one-week delay.
In what is likely the biggest shock of all time in employment reports, nonfarm payrolls actually increased by 2.5 million people in May as the economy started to reopen from the COVID-19 shutdowns. The Dow Jones consensus was for a further decline of 8.3 million. Furthermore, the unemployment rate fell 1.4 points to 13.3% despite estimates of an unemployment rate of 19.5%. The sectors that were impacted most heavily by the pandemic and social distancing in March and April led the recovery. Leisure and Hospitality added 1.2 million jobs, the construction sector gained 464,000, and health care and social assistance added 391,000. Nearly all the other major industries posted smaller gains.
American manufacturers are still struggling from corona-virus related shutdowns and the slowdown in global trade, but they showed faint signs of revival last month, a survey of executives found. The Institute for Supply Management (ISM) said its manufacturing index climbed to 43.1 in May, rebounding off the 11-year low hit in April. The reading suggests the worst of the economic damage from the pandemic may be behind us. Despite the improvement, economists had expected a slightly higher reading of 44. In the report, ISM’s indexes for new orders, production and employment all rose, but from historically low levels that showed the economy shrinking at its fastest pace in a decade. Twelve of the 18 industries tracked by ISM contracted in May. Scott Brown, chief economist at Raymond James stated the report was “still very weak, but with some hope for improvement.”
Retailers, restaurants, and other service-related companies began to recover from the coronavirus pandemic in May, a survey showed. The Institute for Supply Management (ISM) reported the services sector, like the manufacturing sector, also rebounded in May with its first increase in three months. ISM’s Non-Manufacturing Index rose 3.6 points to 45.4. Economists had expected a reading of 44.0. While still in recession territory, the reading indicates a slower pace of contraction in services activity. Three of the four components of the index increased last month. New orders, business activity, and employment all bounced off record low levels, but remained below the breakeven level of 50. Four of the 18 service industries tracked by ISM expanded in May, up from a record-low of just two in April. The services side of the U.S. economy is huge, employing more than 80% of all American workers.
International Economic News: After losing more than three million jobs in March and April, Statistics Canada reported Canada’s economy added more than 290,000 jobs in May. The surge (similar to the one in the United States) means May was the best one-month gain for jobs in Canada in almost 50 years—though it happened from an extremely low level. Despite the job gains, Canada’s official unemployment rate rose to 13.7%. In the report, the vast majority of new jobs came in Quebec, which added 230,900. Every other province added jobs except Ontario, which lost 64,500 positions. The reading came as a pleasant surprise to economists as almost all were expecting more job losses for the month.
Across the Atlantic, a free market Conservative-leaning thinktank stated the United Kingdom should cut taxes and overhaul the Bank of England’s “restrictive” policies as part of a radical new pro-growth strategy. Policy Exchange, which was co-founded by Cabinet Office minister Michael Gove, warned ministers to take a relaxed view of rising levels of debt and use cheap credit to boost the economy and protect jobs. Amid widespread concern that the coronavirus pandemic will push unemployment to levels last seen in the 1980s, the thinktank said cheap borrowing costs would allow the Treasury to increase the deficit further to boost growth. Currently, the Bank of England focuses on keeping inflation “anchored” at about 2%. Critics, such as Policy Exchange consultant Gerard Lyons, believe that’s too restrictive. Lyons said inflation was going to remain low for a long time and so would interest rates.
On Europe’s mainland, France’s economy is set to shrink a record 11% this year, worse than the 8% previously forecast, Finance Minister Brune Le Maire said. “The shock is very brutal,” Le Maire stated. France imposed one of Europe’s strictest lockdowns in the face of COVID-19 in mid-March. The country only began removing restrictions on May 11. Le Maire said that means France must continue with emergency support and pro-business reforms, and not raise taxes that could choke off growth.
Germany unveiled a $146 billion (USD) package of tax and spending measures designed to boost the country’s economic recovery from the coronavirus pandemic. German Chancellor Angela Merkel announced the measures stating, “We have an economic stimulus package, a package for the future, and in addition, we’re now dealing with our responsibility for Europe and the international dimension.” Merkel’s Christian Democratic Union party, as well as coalition partners the Christian Social Union and the left of center Social Democrats all agreed on the measures. As part of the measures, the main value-added tax (VAT) will be temporarily slashed from 19% to 16% for six months as of July 1. Other measures include providing families with an extra 300 euros per child ($336) and doubling rebates for car buyers. The rescue plan also includes a 50 billion euros ($56 billion) fund for achieving climate change innovation and digitization in the German economy.
China was the epicenter of the coronavirus outbreak and the first country to feel the full economic impact of the contagion. Soon, it could be the first to leave it behind. In a research note this week, economic strategists at BlackRock stated the Chinese economy could return to “near-trend growth” as soon as the end of this year. They pointed to swift and significant economic policy actions taken by the Chinese government to curb the economic impact of the outbreak. Indeed, research firm Caixin reported its survey of service industries in China surprised analysts with a strong expansionary reading of 55 in May. Consensus expectations were for a reading of 47. Similar surveys of service industries in other major economies continue to show contraction and sub-50 readings.
A key economic index reflecting the current state of Japan’s economy recorded its largest drop ever in April, government data showed. The Cabinet Office’s coincident index of business conditions fell 7.3 points to 81.5—its sharpest drop since the government began releasing comparable figures in 1985. The decline was the index’s third consecutive decline. The office maintained its assessment that the economy is “worsening”—its most pessimistic expression. A government official stated the index was most influenced by poor shipments of durable consumer goods such as cars and trucks, while demand for steel and other products weakened considerably.
Finally: Among market-moving economic reports the monthly payrolls report is among the most influential—and this week’s report was no disappointment. Almost all analysts were caught flatfooted at its release, with the consensus forecast expecting a loss of 7.25 million additional jobs and an unemployment rate of 19.0%. Kate Bahn, director of labor market policy and economist at the Washington Center for Equitable Growth was only able to mutter “WTF” at the release, while David Donabedian, chief investment officer at CIBC Private Wealth Management was quick to adapt to the new data stating that while the economy remains in a deep recession, “it is also clear that the recovery has begun, and that it is ahead of schedule.” But Paul Krugman, Trump-hating economist at the New York Times, suggested that Trump had somehow “gotten to the BLS” and cooked the numbers (he later apologized, sort of). Chart from Marketwatch.com.

(Sources: All index- and returns-data from Yahoo Finance; news from Reuters, Barron’s, Wall St. Journal, Bloomberg.com, ft.com, guggenheimpartners.com, zerohedge.com, ritholtz.com, markit.com, financialpost.com, Eurostat, Statistics Canada, Yahoo! Finance, stocksandnews.com, marketwatch.com, wantchinatimes.com, BBC, 361capital.com, pensionpartners.com, cnbc.com, FactSet.) Securities offered through Registered Representatives of Cambridge Investment Research Inc., a broker-dealer, member FINRA/SIPC. Advisory Services offered through Cambridge Investment Research Advisors, a Registered Investment Adviser. Strategic Investment Partners and Cambridge are not affiliated. Indices mentioned are unmanaged and cannot be invested into directly. Past performance is no guarantee of future results.
