
6-14-21 Weekly Market Update
The Very Big Picture
The long-term valuation of the market is commonly measured by the Cyclically Adjusted Price to Earnings ratio, or “CAPE”, which smooths-out shorter-term earnings swings in order to get a longer-term assessment of market valuation. A CAPE level of 30 is considered to be the upper end of the normal range, and the level at which further PE-ratio expansion comes to a halt (meaning that further increases in market prices only occur as a general response to earnings increases, instead of rising “just because”). The market was recently at that level.
Of course, a “mania” could come along and drive prices higher – much higher, even – and for some years to come. Manias occur when valuation no longer seems to matter, and caution is thrown completely to the wind – as buyers rush in to buy first, and ask questions later. Two manias in the last century – the “Roaring Twenties” of the 1920s, and the “Tech Bubble” of the late 1990s – show that the sky is the limit when common sense is overcome by a blind desire to buy. But, of course, the piper must be paid, and the following decade or two were spent in Secular Bear Markets, giving most or all of the mania-gains back.
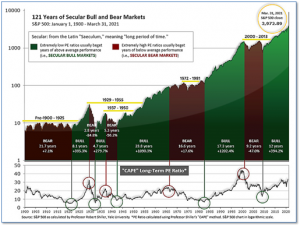
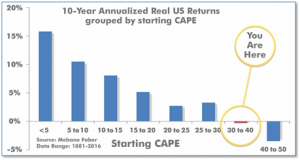
See Fig. 1 for the 100-year view of Secular Bulls and Bears. The CAPE is now at 37.67, up from the prior week’s 37.51. Since 1881, the average annual return for all ten-year periods that began with a CAPE in the 30-40 range has been slightly negative (see Fig. 2).
Note: We do not use CAPE as an official input into our methods. However, if history is any guide – and history is typically ‘some’ kind of guide – it’s always good to simply know where we are on the historic continuum, where that may lead, and what sort of expectations one may wish to hold in order to craft an investment strategy that works in any market ‘season’ … whether current one, or one that may be ‘coming soon’!
The Big Picture:
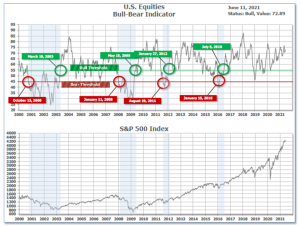
The ‘big picture’ is the (typically) years-long timeframe – the timeframe in which Cyclical Bulls and Bears operate. The U.S. Bull-Bear Indicator is in Cyclical Bull territory at 72.89 up from the prior week’s 71.53.
In the Quarterly- and Shorter-term Pictures
The Quarterly-Trend Indicator based on the combination of U.S. and International Equities trend-statuses at the start of each quarter – was Positive on March 31, indicating positive prospects for equities in the first quarter of 2021.
Next, the short-term(weeks to months) Indicator for US Equities turned Positive on May 20 and ended the week at 22, up from the prior week’s 18.
In the Markets:
U.S. Markets: A sharp decrease in longer-term bond yields appeared to help push the S&P 500 Index to a record high in a week of relatively light summer trading. The technology-heavy NASDAQ Composite Index outperformed, rising 1.8% to 14,069, marking its fourth consecutive weekly gain, while the narrowly focused Dow Jones Industrial Average recorded a modest loss of -0.8% closing at 34,480. By market cap, the large cap S&P 500 rose 0.4%, while the mid-cap S&P 400 and small-cap Russell 2000 finished the week up 0.9% and up 2.2%, respectively.
International Markets: Canada’s TSX rose 0.5%, while the United Kingdom’s FTSE added 0.9%. On Europe’s mainland, Frances CAC 40 rallied 1.3%, while Germany’s DAX finished the week unchanged. In Asia, China’s Shanghai Composite ticked down -0.1% and Japan’s Nikkei rose just 7 points to 28,949—a negligible percentage gain. As grouped by Morgan Stanley Capital International (MSCI), emerging markets retreated -0.8%, while developed markets added 0.5%.
Commodities: Precious metals finished the week mixed. Gold retreated -0.7% to $1879.60 per ounce, while Silver rose 0.9% to $28.15 per ounce. Crude oil continued to break out to the upside rising for a third consecutive week. West Texas Intermediate crude oil finished the week up 1.9% to $70.91 per barrel. The industrial metal copper, viewed by some analysts as a barometer for global economic health due to its wide variety of uses, retraced some of last week’s decline finishing the week up 0.2%.
U.S. Economic News: The number of job openings rose to a record high, but employers say they can’t find enough workers to fill them. The Labor Department reported job openings soared to 9.3 million in April, from a revised 8.3 million in the prior month. Many companies, both big and small, have reported difficulty finding qualified workers. The surprising difficulty in getting people to return to work is tied to a number of problems, economists say. They blame a wave of early retirements, a lack of child-care options, a lingering fear of the coronavirus and generous unemployment benefits. To add fuel to the fire, a record number of people are quitting their jobs. Nearly 4 million people quit in April—double the number from the same time last year. The so-called “quits rate” rose a tick to a record 2.8% among private-sector employees. The quits rate is rumored to be the Federal Reserve’s preferred gauge of the health of the labor market as it is assumed that an employee would only quit a job in favor of a more lucrative one. At the height of the coronavirus crisis, the quits rate had fallen to a seven-year low of 1.8%.
Small business owners reported the labor shortage across the nation is holding back growth. The National Federation of Independent Business (NFIB) stated its small-business index fell for the first time this year over growing labor and inflation worries. The index slipped 0.2 points to 99.6. Business owners say they are losing sales because they can’t find enough people to fill open positions. And now, rising inflation is adding to their worries. In the details of the report, NFIB – the nation’s largest small-business lobbying group – said a record 48% of small businesses surveyed could not fill open jobs, even with many of them offering higher pay. “The labor shortage is holding back growth for small businesses across the country,” said NFIB chief economist Bill Dunkelberg. The businesses that have raised wages in an effort to lure more workers say they plan to pass higher labor costs on to customers, potentially adding upward pressure to U.S. consumer prices. The percentage of businesses raising prices rose to the highest level since 1981.
The cost of living surged again last month, as the pace of inflation soared to a 13-year high of 5%, reflecting the broad increase in prices across the U.S. economy. The consumer price index jumped 0.6% last month to mark the fourth large gain in a row, the government reported. Economists had expected a gain of 0.5%. The rate of inflation over the past year escalated to 5% from 4.2% in the prior month. That put it at the highest level since 2008, a time when the cost of oil hit a record $150 a barrel. Prior to that, the last time inflation was this high was in 1991. Another closely watched measure of inflation that omits volatile food and energy also shot up 0.7% in May. The so-called “core” 12-month rate of inflation climbed to 3.8% from 3%, a 29-year high. The Federal Reserve insists price pressures will subside once the U.S. and global economies regain a more normal footing. The upsurge in inflation is mostly tied to temporary shortages that will fade away as supply catches up to demand, senior Fed officials say.
Sentiment among the nation’s consumers rebounded this month after falling precipitously in May. The University of Michigan reported its (preliminary) index of consumer sentiment rose 3.5 points to 86.4 this month. Economists had forecast a reading of 84.4. In the report, the sub-index that measures how consumers feel about the economy right now rebounded to 90.6 in June from 89.4 last month, due to rapid job gains in recent months. Consumer optimism about the next six months rose to 90.6 in May to 89.4 in the prior month. In a note to clients, Robert Frick, corporate economist with Navy Federal Credit Union wrote, “June’s Consumer Sentiment Survey was mixed, just like how the recovery is playing out. While consumers are rightly frustrated with the current high price of houses, cars and durable goods, they recognize that job growth has finally started moving decisively in the right direction.”
International Economic News: With Canada’s COVID-19 vaccine rollout steadily underway, Canadians can start to look forward to their world returning to normal. The Conference Board of Canada is forecasting a 6.1% increase in real gross domestic product (GDP) in 2021, and a further increase of 3.5% real GDP in 2022, according to its latest report. Pedro Antunes, chief economist at the Conference Board of Canada stated, “Strong activity in the resource sector, manufacturing, and construction has allowed for an upward revision to our growth forecast for 2021 from what we released in our spring Canadian outlook.” By province, Alberta is expected to have the among the strongest recoveries as resource production and manufacturing begin to resume normal operations–and global gas prices stabilize after a major downturn in 2020 and early 2021. Prince Edward Island is also expected to have a quicker recovery, as it had relatively fewer COVID-19 cases during the pandemic.
Across the Atlantic, the United Kingdom’s Office for National Statistics (ONS) reported the UK economy grew by 2.3% in April as the easing of COVID-19 lockdown measures fueled a rebound in consumer spending. The ONS reported UK GDP rose for a third consecutive month with the economy growing at its fastest pace since July of last year. Overall GDP grew by 1.5% in the three months to April compared with the previous three months. Rishi Sunak, the chancellor, said the latest figures were “a promising sign that our economy is beginning to recover”. The ONS said the economic output in April 2021 was 27.6% greater than in April 2020, demonstrating the difference from the worst month of the pandemic a year earlier.
On Europe’s mainland, French Finance Minister Bruno LeMaire stated France’s economy will return to pre-pandemic levels by the first quarter of 2022 as a return of spending and investments lay the groundwork for a recovery. Le Maire, who reaffirmed his target of 5% economic growth for France this year, said the recent surge in credit card payments, rising holiday season bookings and soaring clothing purchases showed that France was quickly returning to growth. The minister said the country’s debt, which ballooned during the pandemic to fund support measures, should begin to stabilize in 2025 and then decrease. He said he expected the public deficit to be below 3% of gross domestic product in 2027.
Germany’s central bank reported it was raising its growth and inflation forecasts for this year and the next, assuming that cases of coronavirus continued to wane. The Bundesbank stated it now expects the German economy to reach pre-pandemic levels as soon as next quarter, growing by 3.7% this year, 5.2% next year and 1.7% in 2023. “The German economy is overcoming the pandemic-related crisis,” said Bundesbank President Jens Weidmann. The German central bank also raised its forecasts for inflation for this year and the next, warning there were still “upside risks”. It now saw inflation at 2.6% this year, which would be the highest since 2008 and well above the European Central Bank’s target of price growth “below but close to 2%”.
In Asia, China’s top economic planners have paused their attempts to reduce carbon emissions as spurring economic growth once again becomes their primary focus. Officials at China’s main economic planning agency, the National Development and Reform Commission, have limited the initial scope of a national carbon-trading system, which was set to go into full operation later this month. As the world’s largest carbon emitter, China’s actions are being closely watched by the rest of the world. China’s President Xi Jinping has said China will reach a peak in its carbon dioxide emissions before 2030, but he hasn’t elaborated on how the country will achieve that goal.
Japan’s economy contracted in the first quarter, but the final reading was better than economists had anticipated. The economy shrank by an annualized 3.9% in January-March–not as bad as the preliminary reading of a 5.1% contraction, but still posting the first fall in three quarters, Cabinet Office data showed. The reading, which beat economists’ forecast for a 4.8% decline, equals a real quarter-on-quarter contraction of 1.0% from the prior quarter—less than the preliminary 1.3% drop. The revised gross domestic product (GDP) decline was mainly due to a smaller fall in public and capital spending, which both eased less than initially thought, offsetting a slightly larger fall in private consumption. “Overall, capital spending and private consumption remained weak, which showed weakness in domestic demand,” said Takeshi Minami, chief economist at Norinchukin Research Institute. However, Economy Minister Yasutoshi Nishimura said spending could recover as consumers return to the streets. “If infections subside, there’ll be pent-up demand from not having been able to go eating out or travelling,” Nishimura said.
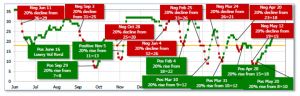
Finally: Record prices for used cars and trucks were the biggest contributor to inflation last month, according to the government’s Consumer Price Index report. Prices for used vehicles surged 7.3% just last month, following an even bigger 10% gain in April. Why are the prices of used vehicles skyrocketing? In short, there are more people buying cars than there are cars in the market. New car trade-ins are usually the biggest source of used cars, but supply chain disruptions, especially a widespread of specialty semiconductors used by auto manufacturers, have limited availability of new vehicles—causing prices of scarce used vehicles to catapult higher. The Manheim Vehicle Value Index, a widely-followed industry yardstick shown in the chart, was described by industry observers as “shocking”. (Chart from Manheim)

(Sources: All index- and returns-data from Yahoo Finance; news from Reuters, Barron’s, Wall St. Journal, Bloomberg.com, ft.com, guggenheimpartners.com, zerohedge.com, ritholtz.com, markit.com, financialpost.com, Eurostat, Statistics Canada, Yahoo! Finance, stocksandnews.com, marketwatch.com, wantchinatimes.com, BBC, 361capital.com, pensionpartners.com, cnbc.com, FactSet.) Securities offered through Registered Representatives of Cambridge Investment Research Inc., a broker-dealer, member FINRA/SIPC. Advisory Services offered through Cambridge Investment Research Advisors, a Registered Investment Adviser. Strategic Investment Partners and Cambridge are not affiliated. Indices mentioned are unmanaged and cannot be invested into directly. Past performance is no guarantee of future results.