6-21-21 Weekly Market Update
The very Big Picture
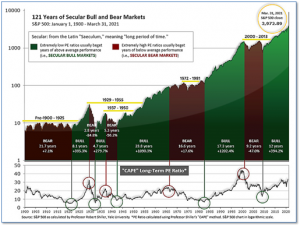
The long-term valuation of the market is commonly measured by the Cyclically Adjusted Price to Earnings ratio, or “CAPE”, which smooths-out shorter-term earnings swings in order to get a longer-term assessment of market valuation. A CAPE level of 30 is considered to be the upper end of the normal range, and the level at which further PE-ratio expansion comes to a halt (meaning that further increases in market prices only occur as a general response to earnings increases, instead of rising “just because”). The market was recently at that level.
Of course, a “mania” could come along and drive prices higher – much higher, even – and for some years to come. Manias occur when valuation no longer seems to matter, and caution is thrown completely to the wind – as buyers rush in to buy first, and ask questions later. Two manias in the last century – the “Roaring Twenties” of the 1920s, and the “Tech Bubble” of the late 1990s – show that the sky is the limit when common sense is overcome by a blind desire to buy. But, of course, the piper must be paid, and the following decade or two were spent in Secular Bear Markets, giving most or all of the mania-gains back.

See Fig. 1 for the 100-year view of Secular Bulls and Bears. The CAPE is now at 36.95, down from the prior week’s 37.67. Since 1881, the average annual return for all ten-year periods that began with a CAPE in the 30-40 range has been slightly negative (see Fig. 2).

Note: We do not use CAPE as an official input into our methods. However, if history is any guide – and history is typically ‘some’ kind of guide – it’s always good to simply know where we are on the historic continuum, where that may lead, and what sort of expectations one may wish to hold in order to craft an investment strategy that works in any market ‘season’ … whether current one, or one that may be ‘coming soon’!
The Big Picture:
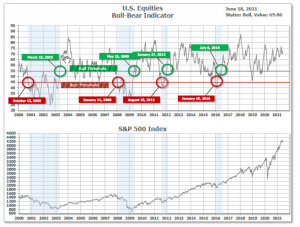
The ‘big picture’ is the (typically) years-long timeframe – the timeframe in which Cyclical Bulls and Bears operate. The U.S. Bull-Bear Indicator is in Cyclical Bull territory at 69.86 down from the prior week’s 72.89.

In the Quarterly- and Shorter-term Pictures
The Quarterly-Trend Indicator based on the combination of U.S. and International Equities trend-statuses at the start of each quarter – was Positive on March 31, indicating positive prospects for equities in the first quarter of 2021.
Next, the short-term(weeks to months) Indicator for US Equities turned negative on June 18 and ended the week at 20, down from the prior week’s 22.

In the Markets:
U.S. Markets: The major U.S. stock benchmarks finished the week by closing solidly lower, with the Dow and S&P 500 posting sharp weekly losses and the NASDAQ erasing its earlier advance for the week. The Dow Jones Industrial Average declined over 1000 points to 33,290, a decline of -3.5%. The technology-heavy NASDAQ remained resilient with just a -0.3% loss. By market cap, large caps showed relative strength declining just -1.9%, while the mid cap S&P 400 and small cap Russell 2000 dropped -5.1% and -4.2%, respectively.
International Markets: All but one major international market finished the week in the red. Canada’s TSX declined ‑0.7%, while the United Kingdom’s FTSE 100 finished down -1.6%. On Europe’s mainland, France’s CAC 40 and Germany’s DAX gave up -0.5% and -1.6%, respectively, while in Asia China’s Shanghai Composite declined -1.8%. Japan’s Nikkei bucked the trend and managed a 0.05% rise. As grouped by Morgan Stanley Capital International, developed markets ended down -3.1%, while emerging markets declined -1.9%.
Commodities: Precious metals ended down for the week, with Gold retreating -5.9% to $1769 an ounce, and Silver giving up -7.7% to $25.97. Energy managed to finish the week with a modest gain. West Texas Intermediate crude oil rose 0.5% to $71.29 per barrel. The industrial metal copper, viewed by some analysts as a barometer of global economic health due to its wide variety of uses, plunged -8.4%.
U.S. Economic News: The number of Americans filing first-time unemployment benefits unexpectedly rose last week to its highest level in a month. The Labor Department reported initial jobless claims rose by 37,000 to 412,000 in the week ended June 12. Economists had forecast claims would continue to fall to 365,000. Meanwhile, the number of people already collecting benefits rose by just 1,000 to 3.52 million—remaining near its lowest level since the onset of the pandemic last year. Jobless claims filings have been trending lower since February as the economy has been recovering from the pandemic. Ian Shepherdson, chief economist at Pantheon Macroeconomics stated claims could fall to the 250,000 level by the end of summer.
The National Association of Home Builders (NAHB) reported high lumber prices, labor shortages, and other barriers are beginning to sap the enthusiasm of home buyers. A survey of builders shows they are still very confident their business will improve, but they are not quite as optimistic as they were at the end of last year. The NAHB monthly confidence index slipped to 81 in June from 83 in May–its lowest level in nine months. Confidence took a huge hit during the early stages of the pandemic as sales briefly nosedived. Yet record low mortgage rates and the end of the nationwide lockdown led to an explosion in demand among home buyers. Despite the recent fall in the price of lumber, prices remain much higher than they were a year ago. NAHB Chairman Chuck Fowke stated in its release, “These higher costs have moved some new homes beyond the budget of prospective buyers, which has slowed the strong pace of home building.”
The Census Bureau reported new construction of single-family houses increased a solid 4.2% in May to a 1.1 million annualized rate, but an indicator of future building activity–permits for future home construction–declined again. Permits have fallen almost 11% from its 15-year high in January. Construction increased sharply in the Midwest and grew more slowly in the South and West. Only the Northeast saw a decline. Home building is much higher in all four regions compared to one year ago, but construction is likely to take place at a more subdued pace until all the bottlenecks ease. “The issue in the housing market, as with much of the broader economy, isn’t the demand side of the market,” said chief economist Richard Moody of Regions Financial. “Rather, it is the ability of producers, in this case home builders, to meet that demand. That is an issue for which there is no quick fix.”
Sales at U.S. retailers fell sharply last month, suggesting the U.S. is no longer getting a big boost from the massive federal fiscal stimulus. The Census Department reported sales at U.S. retailers sank 1.3% in May. Economists had only expected a decline of 0.7%. Sales were held down by fewer purchases of new cars and trucks. Automakers have been unable to keep up with demand as a major global shortage of computer chips has restricted production. If autos are excluded, retail sales fell a smaller 0.7% in May. Still, sales were up 18% compared to the same time last year. Analysts remained optimistic following the release. Economist Katherine Judge of CIBC World Markets stated, “Don’t read too much into the larger than expected drop in U.S. retail sales in May, as it comes on the heels of an upward revision to April and a dramatic fiscal stimulus-fueled spike in March.”
Prices at the wholesale level jumped again in May for the fifth consecutive time—a sign that inflationary pressures tied to the reopening of the U.S. economy and federal stimulus are likely to persist through the summer. The Bureau of Labor Statistics reported its Producer Price Index rose 0.8% last month, exceeding forecasts by 0.3%. Meanwhile, the rate of wholesale inflation over the past 12 months escalated to 6.6% from 6.2% the prior month. That’s the highest level since the index was reformulated in 2009. About 60% of the increase in wholesale inflation last month reflected the higher cost of goods: new autos, gasoline, metals, farm seeds and other agricultural products. Stripping out food, energy, and trade margins, the core rate of wholesale inflation rose 0.7% in May. The annual increase in the core rate over the past 12 months moved up to 5.3%–its largest gain since the government first began reporting it in 2014. Ian Shepherdon of Pantheon Macroeconomics wrote, “No end is in sight to the reopening surge in prices.”
The cost of imported goods climbed again in May and contributed to the biggest flareup in U.S. inflation in more than a decade–a flareup the Federal Reserve insists is “transitory”. The import price index advanced 1.1% in last month, the government reported. Economists had forecast 0.7% increase. Import prices have climbed 11.3% over the past 12 months to mark the fastest pace since 2011. The cost of foreign oil, cars and trucks, consumer goods and industrial supplies all rose in May. Excluding fuel, import prices moved up 0.9%.
The Federal Reserve, acknowledging that inflation may continue to increase, said it might hike interest rates earlier than it had previously expected. In its latest statement, the Fed is now anticipating two rate hikes in 2023. The Fed repeated its belief that inflation would be “transitory”, but Federal Reserve Chairman Jerome Powell stressed that he and his colleagues were in agreement that inflation could rise faster and last longer than expected. The Fed forecast that inflation would move up to 3% annual rate this year but would then drop sharply in 2022. In an outcome that was more hawkish than expected, the Fed’s dot plot chart showed 11 of 18 officials expect at least two rate hikes in 2023. In March, only seven expected even one hike. Furthermore, Powell announced the Fed held its first discussion about slowing down its bond purchases. The Fed has said it wanted to see “substantial further progress” before slowing down their bond purchases–the first step of pulling back all their support for the economy.
Manufacturing activity in the New York region cooled a bit in June according to the latest report from the New York Federal Reserve. The NY Fed’s Empire State Manufacturing Index slipped 6.9 points to 17.4 in June, pulling back from two consecutive strong readings. Economists had expected a reading of 22.3. The subcomponents were also weaker in June. The new-orders index fell 12.6 points to 16.3 in June, while shipments fell 15.5 points to 14.2. Unfilled orders dropped 13.5 points to 7.9. Inventories fell 9.7 points to -2.6. The Empire State index is watched by analysts as an early hint of national trends.
International Economic News: Ratings agency Fitch affirmed Canada’s Long-Term Foreign-Currency and Local-Currency Issuer Default Ratings (IDR) at ‘AA+’ with a Stable Outlook. Fitch notes that its ratings reflect Canada’s structural strength, including “strong governance, political stability, and macro policy framework” which delivered steady growth and low inflation during Canada’s pandemic response. These strengths, however, are balanced by a high public debt burden given Canada’s pension liabilities Fitch added. “The Stable Outlook reflects our expectation that following last year’s sharp rise, general government debt will be placed on a gradual downward path,” Fitch concluded.
Across the Atlantic, the UK’s Confederation of Business Industry (CBI) predicted economic output in the United Kingdom will regain its pre-pandemic level by the end of 2021, a full year earlier than it had previously expected. In its latest forecasts, the business lobby group said gross domestic product would bounce back by 8.2% this year and grow a further 6.1% in 2022, after plunging by 9.9% last year. If that proves right, the recovery this year will be twice as fast as that expected in March by the Office for Budget Responsibility, the independent fiscal watchdog, and significantly stronger over the two-year period than the Bank of England forecast in its May monetary policy report. The newfound confidence reflects the strength of the rebound already seen since retail and hospitality businesses began reopening in April.
On Europe’s mainland, there was similar optimism in France. The Bank of France anticipates the French economy will return to pre-pandemic output at the start of 2022 as the lifting of restrictions and the acceleration of vaccinations fuel a stronger than previously expected rebound in the second half of this year. The central bank raised its 2021 growth forecast to 5.8% from 5.4% in March as it sees strong spending and investment help the French economy outpace the euro-area average. Productivity losses from the crisis are also less than previously estimated, and the institution revised up forecasts for 2022 and 2023. It now expects a 4.1% expansion next year, instead of 3.8% forecast in March.
However, the sentiment in Germany wasn’t as optimistic. In its latest forecast, Germany’s Ifo institute forecasted Germany’s economy will grow by a weaker-than-expected 3.3% this year as supply bottlenecks in manufacturing hold back industrial output. The lower growth forecast for Europe’s largest economy represented a cut of 0.4 percentage points compared to its previous estimate from March, Ifo said. For 2022, the institute raised its GDP growth forecast to 4.3% from 3.2% previously. “In the short term, the bottlenecks in the delivery of primary products in particular are holding back the economy,” Ifo economist Timo Wollmershaeuser said.
In Asia, China’s economic growth moderated in May as investment and domestic consumption fell short of expectations, while factory output remained resilient. China’s industrial production rose 8.8% from a year earlier in May, slowing from April’s 9.8% pace, data from the National Bureau of Statistics showed. The reading of factory output, which was buoyed by strong overseas demand for Chinese-made goods, matched the median forecast made by economists. However, that strength was offset by China’s consumers which have continued to disappoint policymakers who have been hoping for a pivot toward domestic spending as the main driver of its economy. Retail sales, a key gauge of China’s consumption, rose by 12.4% last month compared with a year earlier, but that was down from the 17.7% year-over-year growth rate in April and falling short of the 13.6% gain anticipated by economists.
Japan’s government will include a pledge to achieve a “safe and secure” Tokyo Olympic Games in its economic blueprint, according to a final draft of the document. The final draft came days after Prime Minister Yoshihide Suga said he had won support at a G7 summit meeting in Britain for holding the Olympics despite public concern that the sports extravaganza could worsen the spread of coronavirus infections. “(We) will realize the safe and secure Games while creating various legacies,” the draft said. The government will also clarify its resolve to complete its vaccination program by the end of November. Japan remains well behind other developed nations when it comes to coronavirus vaccination, where just 6% of Japan’s population has been fully vaccinated.
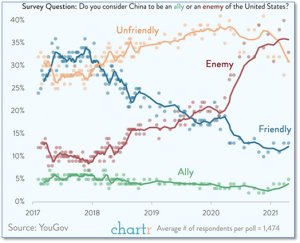
Finally: During the recent London G7 meetings, the United States’ top diplomat, Secretary of State Antony Blinken, rejected questions claiming the U.S. is entering a “cold war” with China. The questions are not out of line with public opinion, however, as revealed in a recent poll. Global public opinion and data company YouGov showed that in 2017 just 10% of respondents polled identified China as an “Enemy” of the U.S. Today, that number is closer to 35%, and is the most-selected choice, followed by “Unfriendly”. (Chart from chartr.com)

(Sources: All index- and returns-data from Yahoo Finance; news from Reuters, Barron’s, Wall St. Journal, Bloomberg.com, ft.com, guggenheimpartners.com, zerohedge.com, ritholtz.com, markit.com, financialpost.com, Eurostat, Statistics Canada, Yahoo! Finance, stocksandnews.com, marketwatch.com, wantchinatimes.com, BBC, 361capital.com, pensionpartners.com, cnbc.com, FactSet.) Securities offered through Registered Representatives of Cambridge Investment Research Inc., a broker-dealer, member FINRA/SIPC. Advisory Services offered through Cambridge Investment Research Advisors, a Registered Investment Adviser. Strategic Investment Partners and Cambridge are not affiliated. Indices mentioned are unmanaged and cannot be invested into directly. Past performance is no guarantee of future results.
