
6-7-21 Weekly Market Update
The very Big Picture
The long-term valuation of the market is commonly measured by the Cyclically Adjusted Price to Earnings ratio, or “CAPE”, which smooths-out shorter-term earnings swings in order to get a longer-term assessment of market valuation. A CAPE level of 30 is considered to be the upper end of the normal range, and the level at which further PE-ratio expansion comes to a halt (meaning that further increases in market prices only occur as a general response to earnings increases, instead of rising “just because”). The market was recently at that level.
Of course, a “mania” could come along and drive prices higher – much higher, even – and for some years to come. Manias occur when valuation no longer seems to matter, and caution is thrown completely to the wind – as buyers rush in to buy first, and ask questions later. Two manias in the last century – the “Roaring Twenties” of the 1920s, and the “Tech Bubble” of the late 1990s – show that the sky is the limit when common sense is overcome by a blind desire to buy. But, of course, the piper must be paid, and the following decade or two were spent in Secular Bear Markets, giving most or all of the mania-gains back.
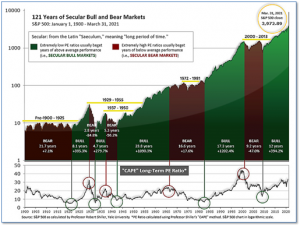
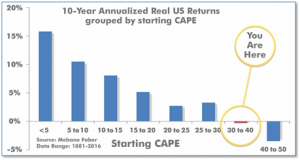
See Fig. 1 for the 100-year view of Secular Bulls and Bears. The CAPE is now at 37.51, up from the prior week’s 37.28. Since 1881, the average annual return for all ten-year periods that began with a CAPE in the 30-40 range has been slightly negative (see Fig. 2).
Note: We do not use CAPE as an official input into our methods. However, if history is any guide – and history is typically ‘some’ kind of guide – it’s always good to simply know where we are on the historic continuum, where that may lead, and what sort of expectations one may wish to hold in order to craft an investment strategy that works in any market ‘season’ … whether current one, or one that may be ‘coming soon’!
The Big Picture:
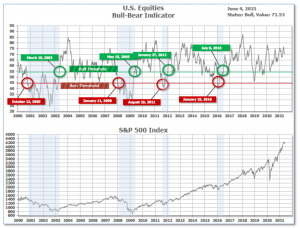
The ‘big picture’ is the (typically) years-long timeframe – the timeframe in which Cyclical Bulls and Bears operate. The U.S. Bull-Bear Indicator is in Cyclical Bull territory at 71.53 up from the prior week’s 70.69.
In the Quarterly- and Shorter-term Pictures
The Quarterly-Trend Indicator based on the combination of U.S. and International Equities trend-statuses at the start of each quarter – was Positive on March 31, indicating positive prospects for equities in the first quarter of 2021.
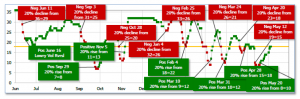
Next, the short-term(weeks to months) Indicator for US Equities turned Positive on May 20 and ended the week at 18, up from the prior week’s 14.
In the Markets:
U.S. Markets: The major U.S. indexes closed moderately higher in a shortened trading week. Energy shares performed best within the S&P 500 Index as oil prices reached their highest level in two years. The Dow Jones Industrial Average added 227 points to finish the week at 34,756 – a gain of 0.7%. The technology-heavy NASDAQ Composite rose 0.5% to 13,814. By market cap, the large cap S&P 500 gained 0.6%, while the mid cap S&P 400 finished the week flat, and the small cap Russell 2000 added 0.8%.
International Markets: Canada’s TSX booked its third consecutive week of gains by adding 0.9%, while the United Kingdom’s FTSE 100 rose 0.7%. On Europe’s mainland, France’s CAC 40 gained 0.5% and Germany’s DAX added 1.1%. In Asia, China’s Shanghai Composite finished down -0.2%, while Japan’s Nikkei ended down -0.7%. As grouped by Morgan Stanley Capital International, developed markets finished the week up 1.1%, while emerging markets gained 2%.
Commodities: Gold had its first down week in five, giving up 0.7% to $1892.00 per ounce. Likewise, Silver retreated -0.4% to $27.90. Crude oil hit new highs for the year. West Texas Intermediate crude rose 4.9% to $69.62 per barrel. The industrial metal copper, viewed by some analysts as a barometer of world economic health due to its wide variety of uses, finished the week down -3.2%.
U.S. Economic News: The number of Americans filing for first-time unemployment benefits fell below 400,000 for the first time since the coronavirus pandemic took hold more than a year ago. The Labor Department reported initial jobless claims dropped by 20,000 to 385,000 in the week ended May 29th. It was the fifth consecutive decline in initial jobless claims. Economists had forecast new claims would slip to 393,000. Of note, new unemployment claims remain almost twice as high as they were before the pandemic–new applications had been running in the low 200,000s before the viral outbreak in early 2020. Continuing claims, which counts the number of Americans already receiving benefits, rose by 169,000 to 3.77 million. That number is reported with a one-week delay. Ian Shepherdson chief economist of Pantheon Macroeconomics stated, “Claims remain elevated by normal standards, but the downward trend has been relentless in recent months, and a return to the pre-Covid level, in the low 200,000s, over the summer seems a decent bet.”
The U.S. added a modest 559,000 jobs in May, falling short of Wall Street expectations. Economists had forecast 671,000 new jobs would be created. The unemployment rate, meanwhile, slipped in May to a pandemic low of 5.8% from 6.1%. Economists say early retirements, a lack of child-care options, lingering fear of the coronavirus and generous unemployment benefits explain why more people haven’t returned to work. The bulk of the new jobs in May were created by the businesses that suffered the biggest declines in employment during the pandemic. Restaurants added 186,000 new jobs last month as more Americans went out to eat. Other service-oriented businesses such as hotels, museums, parks and entertainment venues also added scores of new jobs. However, employment shrank in construction and retail. Home builders still can’t find enough skilled tradespeople despite an industry boom.
American manufacturers have been flooded with new orders for all sorts of goods, but they are struggling to keep up amid widespread shortages of materials and labor. The Institute for Supply Management (ISM) reported its manufacturing sector index rose 0.5% to 61.2% in May. Economists had expected a reading of just 60.7%. Yet the ISM manufacturing report showed production and hiring actually slowed and companies fell further behind in filling new orders. Backlogs rose to the highest level on record. Economists state the economy is recovering so rapidly from the coronavirus pandemic that big strains are being put on many companies. Nor is demand expected to slow down anytime soon. A measure of future activity, new orders, rose to 67% – near a 17-year high.
On the vastly larger services side of the U.S. economy, ISM reported its survey of businesses such as retailers, restaurants, and hotels climbed 1.3 points to a record high of 64% last month. Readings above 50 signal expansion, while those above 60 are considered exceptional. “The rate of expansion is very strong, as businesses have reopened and production capacity has increased” said Anthony Nieves, chairman of the survey. Economists had forecast the index would total 62.5%. All 18 service industries tracked by ISM expanded last month – a rarity. The indexes for production and new orders both increased and topped the 60% mark, pointing to an explosion in demand.
The Federal Reserve’s ‘Beige Book’, a collection of anecdotal reports from each of its member banks, sees a pickup in U.S. economic growth in its latest report. The U.S. economy expanded at a “moderate pace” in April and May as consumer spending picked up and manufacturing activity increased, the report found. In the report, the St. Louis Fed noted, a job fair held by a dozen restaurants to find 100 workers drew barely a dozen applicants, while the Atlanta Fed reported firms in their region believed labor shortages would abate this fall.
International Economic News: Data released last week showed that Canada’s economy likely contracted in April, its first decline in a year, due to widespread lockdowns amid a third wave of coronavirus infections. In its preliminary estimate, Statistics Canada said the economy contracted 0.8% in April. Real GDP had grown 11 months in a row through March, when it grew 1.1%. Economists said the April decline was largely expected and is unlikely to change the Bank of Canada’s outlook for interest rate hikes. The Canadian economy grew 5.6% on an annualized basis in the first quarter, as restrictions were eased, and buoyed by strong housing investment and more mortgage debt. The gain missed analyst expectations of 6.7%.
Across the Atlantic, Britain has clinched post-Brexit trade agreements with Norway, Iceland and Liechtenstein as it seeks to forge new global trading relationships after leaving the European Union. Under the deal with Norway, import tariffs on Norwegian fish and seafood, its second-largest industry after oil and gas production, would be reduced, with no tariffs due on white fish, such as cod–a benefit for the fish processing industry in the north of England. The main focus of Britain’s post-Brexit trade policy has been to pivot its economic center away from Europe and towards fast growing economies in the Asia-Pacific region. It is expected to seal a deal with Australia later this month and is seeking to join a trans-Pacific trade pact.
On Europe’s mainland, the EU’s four biggest economies have raised the pressure for a landmark agreement to be reached at G7 meetings in London intended to curb tax abuse by multinational companies. Sending a united message, the finance ministers of France, Germany, Italy and Spain said a critical moment had been reached to strike a blow against tax avoidance as governments around the world attempt to rebuild from the Covid-19 pandemic. Two days of talks between G7 finance ministers are underway to reach a breakthrough agreement to raise more tax from companies such as Google, Facebook, Amazon and other global giants.
In Asia, China’s Vice Premier Liu He and U.S. Treasury Secretary Janet Yellen spoke this week for the first time since President Joe Biden took office. Both the U.S. and China said the two leaders talked about the economy and cooperation, and “frankly” discussed issues of concern. Yellen discussed the Biden administration’s plans to “support a continued strong economic recovery and the importance of cooperating on areas that are in U.S. interests.” Liu and Yellen agreed the two countries’ economic relationship is “very important,” Chinese state media said, according to a CNBC translation. Despite the hoopla, neither side shared further details on the conversation. The world’s two largest economies have remained close trading partners despite geopolitical tensions.
Japan’s economy likely shrank slightly less than initially estimated in the first quarter, a recent poll showed, though state of emergency curbs to combat the coronavirus pandemic are seen keeping any rebound in the current quarter modest. Revised gross domestic product (GDP) data will likely show the world’s third-largest economy shrank an annualized 4.8% in January-March, less than a preliminary reading of a 5.1% drop, according to economists. Despite the upward revision, many analysts remain cautious about Japan’s economic outlook as extended state of emergency curbs weigh on consumption. Saisuke Sakai, an economist at Mizuho Research & Technologies stated, “We expect Japan’s economy to suffer two straight quarters of contraction in April-June as chip supply shortages hurt car output and state of emergency curbs weigh on consumption.”
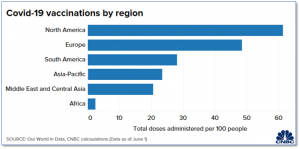
Finally: As COVID-19 vaccination efforts continue here in North America, how exactly are we doing relative to the rest of the world? It turns out, actually pretty well. North America has now reached approximately 60% of its population vaccinated, followed closely by Europe at 48.5% of its population. Surprisingly, the Asia-Pacific region has one of the lowest vaccination rates in the world. Analysts report that skepticism over the newly developed vaccines seems to be the common reason for hesitance everywhere, but even more so in Asia where fairly effective containment in the very early stages of the Covid-19 crisis seems to have led to a lower current sense of urgency. Africa, at less than 5%, is reportedly stymied by a triple-whammy of suspicious populations, under-developed distribution networks and widespread shortages of vaccines. (Chart from CNBC)
(Sources: All index- and returns-data from Yahoo Finance; news from Reuters, Barron’s, Wall St. Journal, Bloomberg.com, ft.com, guggenheimpartners.com, zerohedge.com, ritholtz.com, markit.com, financialpost.com, Eurostat, Statistics Canada, Yahoo! Finance, stocksandnews.com, marketwatch.com, wantchinatimes.com, BBC, 361capital.com, pensionpartners.com, cnbc.com, FactSet.) Securities offered through Registered Representatives of Cambridge Investment Research Inc., a broker-dealer, member FINRA/SIPC. Advisory Services offered through Cambridge Investment Research Advisors, a Registered Investment Adviser. Strategic Investment Partners and Cambridge are not affiliated. Indices mentioned are unmanaged and cannot be invested into directly. Past performance is no guarantee of future results.