
5-6-19 Weekly Market Update
The very big picture:
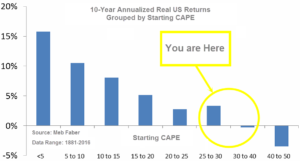
The long-term valuation of the market is commonly measured by the Cyclically Adjusted Price to Earnings ratio, or “CAPE”, which smooths out shorter-term earnings swings in order to get a longer-term assessment of market valuation. A CAPE level of 30 is considered to be the upper end of the normal range, and the level at which further PE-ratio expansion comes to a halt (meaning that increases in market prices only occur in a general response to earnings increases, instead of rising “just because”). The market is currently at that level.
Of course, a “mania” could come along and drive prices higher – much higher, even – and for some years to come. Manias occur when valuation no longer seems to matter, and caution is thrown completely to the wind as buyers rush in to buy first and ask questions later. Two manias in the last century – the 1920’s “Roaring Twenties” and the 1990’s “Tech Bubble” – show that the sky is the limit when common sense is overcome by a blind desire to buy. But, of course, the piper must be paid and the following decade or two are spent in Secular Bear Markets, giving most or all of the mania gains back.

See Fig. 1 for the 100-year view of Secular Bulls and Bears. The CAPE is now at 31.05, up from the prior week’s 30.99, above the level reached at the pre-crash high in October, 2007. Since 1881, the average annual return for all ten year periods that began with a CAPE around this level have been in the 0% – 3%/yr. range. (see Fig. 2).
In the big picture:
The “big picture” is the months-to-years timeframe – the timeframe in which Cyclical Bulls and Bears operate. The U.S. Bull-Bear Indicator (see Fig. 3) is in Cyclical Bull territory at 69.39, up from the prior week’s 67.69.

In the intermediate and Shorter-term picture:
The Shorter-term (weeks to months) Indicator (see Fig. 4) turned negative on March 22nd. The indicator ended the week at 33, down from the prior week’s 34. Separately, the Intermediate-term Quarterly Trend Indicator – based on domestic and international stock trend status at the start of each quarter – was positive entering April, indicating positive prospects for equities in the second quarter of 2019.

Timeframe summary:
In the Secular (years to decades) timeframe (Figs. 1 & 2), the long-term valuation of the market is historically too high to sustain rip-roaring multi-year returns. The Bull-Bear Indicator (months to years) remains positive (Fig. 3), indicating a potential uptrend in the longer timeframe. In the intermediate timeframe, the Quarterly Trend Indicator (months to quarters) is positive for Q2, and the shorter (weeks to months) timeframe (Fig. 4) is negative. Therefore, with two indicators positive and one negative, the U.S. equity markets are rated as Neutral.
In the markets:
U.S. Markets: An impressive rally on Friday erased earlier intra-week losses and brought the major indexes back to roughly flat for the week. The Dow Jones Industrial Average ended the week down 38 points, closing at 26,504, a small decline of -0.14%. The technology-heavy NASDAQ Composite gained 0.2% ending the week at 8,164. By market cap, the smaller cap benchmarks outperformed large caps with the small cap Russell 2000 rising 1.4%, the mid cap S&P 400 added 0.4%, and the large cap S&P 500 gained 0.2%.
International Markets: Canada’s TSX finished the week off -0.7%, and the UK’s FTSE 100 closed the week down ‑0.6%. Markets were mixed on Europe’s mainland with France down -0.4%, but Germany’s DAX rising 0.8%. In Asia, China’s Shanghai Composite, which has had a rough go of late, fell an additional -0.3%. Japan’s Nikkei was closed this week as the nation welcomes a new emperor. As grouped by Morgan Stanley Capital International, both emerging and developed markets finished the week up 0.8%.
Commodities: Gold retraced some of last week’s gain by retreating -0.6% to $1281.30 an ounce. Silver also finished down for the week by -0.2% to $14.98 an ounce. Oil finished down a second week with West Texas Intermediate crude retreating -2.2% to $61.94 per barrel. Copper, seen as a barometer of global economic health due to its variety of industrial uses, finished down a third consecutive week, giving up -2.6%.
April Summary: All major US indices were higher for the month of April. The Dow rose 2.6%, and the NASDAQ gained 4.7%. Large caps and mid caps each gained 3.9%, while small caps rose a lesser but still robust 3.3%. International markets were higher with few exceptions. Canada’s TSX rose 3% and the UK’s FTSE rose 1.9%. France’s CAC gained 4.4%, while Germany’s DAX surged 7.1%. China’s Shanghai Composite bucked the positive results by declining -0.4%, but Japan’s Nikkei surged 5%. Developed markets rose 2.9%, while emerging markets added 2.4%. Gold retreated -1.3% in April, while Silver gave up -0.9%. Oil rose 3%, but copper performed poorly, giving up -4%.
U.S. Economic News: The number of Americans applying for first-time unemployment benefits rose to a three-month high of 230,000. However, analysts noted that the higher reading was likely due to the recent Easter holiday and spring break. Economists had forecast new claims would fall to 215,000. The less-volatile monthly average of new claims rose by 6,500 to 212,500 but remained near their lowest level in almost fifty years. Continuing claims, which counts the number of people already receiving benefits, edged up 17,000 to 1.67 million.
The U.S. created 263,000 jobs in April and unemployment fell to an almost 50-year low, according to the Labor Department’s Non-Farm Payrolls (NFP) report. In the latest reading, the increase in hiring was concentrated in white collar services, construction, and health care. The only sector that suffered a large loss of employees was retail, where employment fell for a third straight month. The increase in new jobs easily surpassed economists’ forecasts of an NFP of 213,000. Meanwhile, the unemployment rate dipped 0.2% to 3.6% in March, marking the lowest level since December of 1969. The increase in pay over the last 12 months remained unchanged at 3.2%. That leveling off is thought to ease any worries at the Federal Reserve about rising wages triggering a sharp increase in inflation.
The private sector saw job growth surge by over 275,000 new positions in April, according to payrolls processor ADP. The ADP reading topped economists’ consensus expectations for 180,000 jobs added. However, Mark Zandi Moody’s Analytics chief economist cautioned that market participants shouldn’t be overly optimistic following the report. “The number overstates the case,” Zandi said. ADP’s increases in April were concentrated in the service sector, it accounted for 223,000 of the jobs added. By size, small businesses added 77,000 jobs, medium-sized businesses added 145,000, and large businesses accounted for 53,000 of the job gains.
An index of pending-home sales rose 3.8% in March according to the National Association of Realtors (NAR). Economists had expected just a 0.7% increase. The NAR’s pending-home sales index tracks the number real estate deals in which a contract has been signed but not yet closed. The number has been volatile over the past several months, but the trend has generally been down. In the details, only the Northeast region saw a decline, of 1.7%. Pending home sales were up 4.4% in the South, 2.3% in the Midwest, and a solid 8.7% in the West.
U.S. home prices rose a seasonally-adjusted 0.2% in February according to S&P CoreLogic’s Case-Shiller 20-city home price index. The reading was 3.0% higher than the same time last year, but was the slowest pace of annual growth since September of 2012. The reading missed the Econoday consensus forecast of a 3.2% yearly increase. In the details, 14 of the 20 cities reported monthly price increases, but only one city had a bigger price increase on an annual basis than in January. Major cities in California, which have been impacted by sizable tax-law changes implemented in 2017, were hit the hardest with Los Angeles, San Francisco, and San Diego showing the slowest annual price growth in the three months ending in February. Las Vegas, Phoenix, and Tampa were the top three metro areas.
Spending by US consumers jumped in March, supporting views that the economy is on firm footing. The Government’s Bureau of Economic Analysis reported spending rose 0.9% in March following a 0.1% gain the month before. The gain was the largest monthly gain in almost a decade. In addition, personal incomes increased 0.1% in March and remained on a moderate growth path. Economists had been expecting a 0.8% gain in consumer spending and a 0.4% gain in income. The closely watched core Personal Consumption Expenditures (PCE) inflation rate remained flat in March, bringing the annual rate down 0.1% to 1.6%. That reading was the lowest since September of 2017. The muted PCE inflation rate supported the Fed’s decision to stay on the sidelines this week. Jim O’Sullivan, chief U.S. economist at High Frequency Economics, said growth remains too strong for a rate cut, while inflation remains too weak for a rate hike.
Confidence among the nation’s consumers rebounded in April, reinforcing views that the economy continues growing steadily. The Conference Board reported its Consumer Confidence Index rose 5 points to 129.2 this week, whereas economists had expected a reading of 126.9. In the details, the present situation index rose 5.3 points to 168.3, and the survey of future expectations moved up to 103 from 98.3. Both are near their highest levels in a decade. Lynn Franco, Director of Economic Indicators at the board stated, “Overall, consumers expect the economy to continue growing at a solid pace into the summer months.”
Manufacturing activity expanded at its slowest pace in more than two years last month, according to the Institute for Supply Management (ISM). ISM stated its manufacturing index slipped 2.5 points to 52.8 in March. Economists had expected a reading of 54.7. Still, while ratings over 50 indicate expansion, the rate of that expansion is the weakest since October of 2016. In the details, the new-orders index slid 5.7 points to 51.7, while the employment gauge dropped 5.1 points to 52.4. The ISM index is compiled from a survey of executives who order raw materials and other supplies for their companies.
International Economic News: Bank of Canada Governor Stephen Poloz stated this week that interest rates would rise from their current “very low” levels if headwinds affecting the Canadian economy were to dissipate. Poloz told a government banking committee that high levels of personal debt meant the economy was more sensitive to interest rate levels than ever before. Last week, the central bank made that clear rate hikes were off the table for now, given the Canadian economy was struggling to cope with lower oil prices, weak household spending and the impact of global trade conflicts. The bank’s main overnight rate is 1.75%, well below the so-called neutral range of 2.25%-3.25%, where monetary policy is believed to neither stimulate nor restrain growth.
The Bank of England raised its growth forecast for the British economy for the next three years and stated future interest rate increases could be “more frequent” than expected if the economy performs as forecast. Governor Mark Carney stated that if there is a resolution to the Brexit impasse, and inflation and growth pick-up, then more increases are likely. As expected, the Bank kept its key interest rate on hold at 0.75% at its latest policy meeting. In its Quarterly Inflation Report, the Bank of England raised its UK growth forecast for this year, in part because the outlook for the global economy is a bit brighter. The Bank now sees growth of 1.5% this year, up from February’s forecast of 1.2%.
The French economy maintained a steady level of growth in the first quarter of the year as household spending recovered after often-violent anti-government “yellow vest” protests swept the nation. The Eurozone’s second biggest economy grew 0.3% in the first quarter, French national statistics agency INSEE reported. The preliminary reading was in line with the average expectation, and just a tick below the 0.4% reported for the broader Eurozone. Some economists were disappointed that French consumer spending had not rebounded more strongly, given government pledges to cut taxes and boost pensions in response to the “yellow vest” protests.
The jobless rate in Europe’s economic powerhouse Germany held steady at its lowest level since reunification in 1990, the German Federal Labor Agency reported. The agency stated just 4.9% of Germans were out of work in April, matching March’s level. The Federal Labor Agency’s Chief Detlef Scheele said in a statement, “As spring picks up, unemployment and underemployment plummeted again in April, employment continues to increase and business demand for new employees is at a very high level.” Record low jobless figures have persisted despite Berlin halving its economic growth forecast for 2019 this week to just 0.5%. “The labour market remains a ray of hope amid the clouded economic outlook,” said analyst Martin Mueller of public investment bank KfW.
Chinese factory activity expanded for a second month but at a much slower pace than expected, government data showed. China’s statistics bureau reported the official Purchasing Managers Index (PMI) for manufacturing fell to 50.1 in April, down 0.4 point from March. The reading just barely held above the neutral 50 level that separates expansion from contraction. Analysts had expected the PMI to match March’s 50.5. Julian Evans-Pritchard, senior China economist at Capital Economics, said in a research note, “For now, the official PMIs suggest that Q2 got off to a weaker start and reinforce our view that there are still some downside risks to near-term activity.” While the official factory survey disappointed on the growth front, it did not show a marked deterioration in business conditions. Output expanded at a slower but still moderate pace, while growth in the new orders PMI component eased only slightly.
Finally: Is the bull market in stocks, now in its tenth year, reaching the frothy, speculative stage that is typical of a major top? Not according to an indicator created by top minds at the Harvard School of Business and NYU. Harvard professor Malcolm Baker and NYU finance professor Jeffrey Wurgler created a stock market sentiment index that has an impressive historical record of identifying periods of extreme bullishness (marking many market tops) or extreme bearishness (marking many bottoms). Note from the chart that the top of the internet bubble was the last time their index indicated extreme bullish sentiment that has occurred two standard deviations away from the mean, or only about 5% of the time. Currently, the index is not only significantly lower, it is actually below zero. Obviously, not all tops are accompanied by extreme bullishness – the market top in 2007 was one of those instances – but when extreme bullishness does occur, historically a market top is also at hand.

(sources: all index return data from Yahoo Finance; Reuters, Barron’s, Wall St Journal, Bloomberg.com, ft.com, guggenheimpartners.com, zerohedge.com, ritholtz.com, markit.com, financialpost.com, Eurostat, Statistics Canada, Yahoo! Finance, stocksandnews.com, marketwatch.com, wantchinatimes.com, BBC, 361capital.com, pensionpartners.com, cnbc.com, FactSet) These are the opinions of WE Sherman and Co and not necessarily those of Cambridge, are for informational purposes only, and should not be construed or acted upon as individualized investment advice.
Securities offered through Registered Representatives of Cambridge Investment Research Inc., a broker-dealer, member FINRA/SIPC. Advisory Services offered through Cambridge Investment Research Advisors, a Registered Investment Adviser. Strategic Investment Partners and Cambridge are not affiliated.
Indices mentioned are unmanaged and cannot be invested into directly. Past performance is no guarantee of future results. All Investing involves risk. Depending on the types of investments, there may be varying degrees of risk. Investors should be prepared to bear loss, including total loss of principal.