
5/13/19 Weekly Market Update
The very big picture:
The long-term valuation of the market is commonly measured by the Cyclically Adjusted Price to Earnings ratio, or “CAPE”, which smooths out shorter-term earnings swings in order to get a longer-term assessment of market valuation. A CAPE level of 30 is considered to be the upper end of the normal range, and the level at which further PE-ratio expansion comes to a halt (meaning that increases in market prices only occur in a general response to earnings increases, instead of rising “just because”). The market is currently at that level.
Of course, a “mania” could come along and drive prices higher – much higher, even – and for some years to come. Manias occur when valuation no longer seems to matter, and caution is thrown completely to the wind as buyers rush in to buy first and ask questions later. Two manias in the last century – the 1920’s “Roaring Twenties” and the 1990’s “Tech Bubble” – show that the sky is the limit when common sense is overcome by a blind desire to buy. But, of course, the piper must be paid and the following decade or two are spent in Secular Bear Markets, giving most or all of the mania gains back.

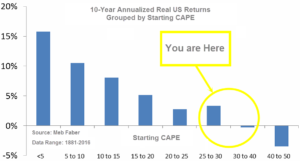
See Fig. 1 for the 100-year view of Secular Bulls and Bears. The CAPE is now at 30.38, down from the prior week’s 31.05, above the level reached at the pre-crash high in October, 2007. Since 1881, the average annual return for all ten year periods that began with a CAPE around this level have been in the 0% – 3%/yr. range. (see Fig. 2).
In the big picture:
The “big picture” is the months-to-years timeframe – the timeframe in which Cyclical Bulls and Bears operate. The U.S. Bull-Bear Indicator (see Fig. 3) is in Cyclical Bull territory at 66.32, down from the prior week’s 69.3.

In the intermediate and Shorter-term picture:
The Shorter-term (weeks to months) Indicator (see Fig. 4) turned negative on March 22nd. The indicator ended the week at 29, down from the prior week’s 33. Separately, the Intermediate-term Quarterly Trend Indicator – based on domestic and international stock trend status at the start of each quarter – was positive entering April, indicating positive prospects for equities in the second quarter of 2019.

Timeframe summary:
In the Secular (years to decades) timeframe (Figs. 1 & 2), the long-term valuation of the market is historically too high to sustain rip-roaring multi-year returns. The Bull-Bear Indicator (months to years) remains positive (Fig. 3), indicating a potential uptrend in the longer timeframe. In the intermediate timeframe, the Quarterly Trend Indicator (months to quarters) is positive for Q2, and the shorter (weeks to months) timeframe (Fig. 4) is negative. Therefore, with two indicators positive and one negative, the U.S. equity markets are rated as Neutral.
In the markets:
U.S. Markets: A rally late Friday afternoon pulled the major U.S. indexes back from their worst weekly declines since the end of last year as the trade tensions between the U.S. and China continued to escalate. The technology-heavy NASDAQ Composite performed the worst, falling over -3% to 7,916, while the Dow Jones Industrial Average fell -2.1% to 25,942. By market cap, small caps performed the worst with the Russell 2000 giving up -2.5%, while the large cap S&P 500 and mid cap S&P 400 retreated -2.2% and -2.4%, respectively.
International Markets: Like the U.S., international markets were a sea of red last week. Canada’s TSX fell -1.2% and the UK’s FTSE 100 dropped -2.4%. On Europe’s mainland, France’s CAC 40 ended down -4.0% and Germany’s DAX fell -2.8%. In Asia, China’s Shanghai Composite had its third consecutive week of losses, giving up -4.5%, while Japan’s Nikkei dropped -4.1%. As grouped by Morgan Stanley Capital International, developed markets fell ‑2.5%, while emerging markets plunged -5.1%.
Commodities: Precious metals ended the week mixed, despite the volatility in the financial markets. Gold rose 0.5% ending the week at $1287.40 an ounce, but Silver ended down -1.3% to $14.70 an ounce. Energy had its third consecutive down week, retreating -0.5% to $61.66 per barrel. Copper, viewed by some analysts as a barometer of global economic health due to its variety of industrial uses, closed down a fourth week in a row, giving up -1.6%.
U.S. Economic News: The number of Americans applying for new unemployment benefits fell slightly last week to 228,000, remaining near multi-decade lows in one of the strongest labor markets in decades. The Labor Department reported initial jobless claims fell by 2,000, far less than the drop of 12,000 that economists had expected. The more stable monthly average of new claims rose by 7,750 to 220,250. Continuing claims, which counts the number of people already receiving benefits, increased by 12,000 to 1.68 million. That number is reported with a one-week delay.
The Labor Department’s Job Openings and Labor Turnover Survey (JOLTS) report showed that the number of job openings in the U.S. rebounded to a near-record high of 7.49 million in March and that companies are still hiring despite an economy that is not growing as quickly as it was a year earlier. The month before, job openings had fallen to a nine-month low of 7.14 million. In the details, transportation and warehousing companies increased their number of openings by 87,000, while construction firms advertised 73,000 new positions. The closely-watched “quits rate” remained flat at 2.5% among private-sector employees. Analysts watch that number for the underlying health of the economy as it is assumed that workers would only leave their jobs if they were confident of finding more lucrative ones. While the pace of hiring has slowed since last fall, there still remains more jobs available than there are unemployed Americans. Julia Pollak, a labor economist at employment marketplace ZipRecruiter stated, “Job openings have now exceeded the number of unemployed Americans for 13 straight months.”
Wholesale prices rose a modest 0.2% in April, indicating that inflation remains under control. Economists had predicted a 0.3% gain. Over the past year, wholesale inflation remained at a low 2.2% increase. The price for gas and services rose the most last month, while food costs fell 0.2%. Excluding food, energy, and trade margins, the so-called core PPI rose 0.4% last month. On an annual basis, core PPI increased to 2.2% in April. For consumers, rising rent costs and the higher cost of fuel led to an increase in inflation for the second month in a row, but price pressures remain far below levels that could threaten the U.S. economy. The Bureau of Labor Statistics’ CPI rose 0.3% last month, missing economists’ forecasts of a 0.4% advance. Over the past 12 months, the cost of living edged up to 2% from 1.9%. Ex-food and energy, core CPI at the consumer level rose just 0.1% for the third month in a row. Chief economist David Berson of Nationwide wrote in a note to clients, “This rise in inflation will not be enough to get the Fed to change the expected flat course of monetary policy — especially with a growing risk of trade tensions causing a slowdown in economic growth.”
The U.S. trade deficit rose slightly in March, but remained below year-ago levels in a sign that the gap may not weigh on the economy as much this year as it did in 2018. The chief reason was a smaller trade gap with China. The Commerce Department reported the trade deficit with China fell in March to its lowest level in more than three years, primarily due to a decline in imports amid the growing trade dispute with the Trump White House. In March, the trade deficit rose 1.5% to $50 billion. Economists had expected a gap of $50.1 billion. Imports rose 1.1% as oil, food, and industrial supplies increased. However, the U.S. imported fewer cell phones, consumer electronics, and other household goods—products that come primarily from China.
According to the Federal Reserve’s second edition of its Financial Stability report, debt issuance to riskier areas of the business sector has picked up but the sector “is resilient”. The report noted the share of newly issued large loans to corporations with high leverage increased over the last nine months and now exceeds previous peak levels observed in 2007 and 2014 when underwriting quality was poor. Federal Reserve economists note there is worry that this small corner of the debt market could serve as a powder keg that could worsen the next economic downturn. Leveraged loans are floating-rate loans made to businesses rated below investment grade, often used to finance mergers and private-equity deals. The Fed has tried to rein in that area of lending in the past, but has faced significant resistance from banks and politicians.
International Economic News: Statistics Canada reported the Canadian economy added 106,500 jobs last month—the most in a month since 1976. The number surprised analysts as Canada’s labor market had its biggest one-month surge since the government began collecting data. The increase pushed the unemployment rate down 0.1% to 5.7%. Meanwhile, employment grew 0.6%, its highest proportional expansion since 1994. According to Thomson Reuters, economists had only expected a gain of 10,000 jobs for the month. In the details, the overall gain was driven by the creation of 73,000 full-time jobs and 83,800 positions in the private sector. Compared with a year earlier, Canada added 426,400 jobs for a proportional increase of 2.3%. Canada’s labor market has created an average of 36,000 jobs per month over the past year.
Across the Atlantic, economic growth in the United Kingdom picked up due to unprecedented stockpiling by manufacturers fearful of the consequences of a “no-deal” Brexit scenario. Britain’s economy grew by 0.5% in the first quarter of the year bolstered by the strongest quarterly performance for manufacturers since 1988. The Office for National Statistics reported factory output rose 2.2% over that period. The services sector, which accounts for more than three quarters of the UK’s GDP, rose 0.3% in the first quarter. Tej Parikh, senior economist at the Institute of Directors believes the strong first quarter figures could be a one-off event. He said: “Some businesses brought activity forward early this year in preparation for leaving the EU, so higher stocks and earlier orders have artificially bumped up the growth numbers.”
The latest forecast from the European Commission predicts that France will see a dramatic weakening of its economy from the so-called “yellow vest” protests. The French economy has been hit by the repercussions of anti-government protests in many of France’s major cities initially sparked by sharp increases in fuel taxes. President Emmanuel Macron last month vowed to take actions to appease the ‘yellow vest’ movement with his plans including tax cuts, higher pensions and a reform of the civil service. But his plans did not stop the European Commission forecasting a slowdown for 2019, with Brussels predicting the economy will grow by 1.3% this year. This is down from a growth rate of 1.6% recorded in 2018 and the 2.2% growth seen in 2017.
Europe’s economic powerhouse got an unexpected surprise–Germany reported a rise in exports in March, supporting views that its economy may be more resilient in the face of global economic challenges than previously thought. Exports rose 1.5% from February and 1.9% from the same time the year before, according to the government statistics office Destatis. Analysts had expected a decline of 0.3%. The exports figures reinforced evidence that growth is picking up in Europe’s biggest economy. Cathal Kennedy, European economist at RBC Capital Markets wrote, “Having narrowly avoided a technical recession in the second half of 2018, the German economy is set for a rebound in the first quarter of 2019.”
China has now made it clear – for the first time – what it expects to see from the U.S. to end its trade war. In an interview with Chinese media after trade talks ended this week, Vice Premier Liu He said that in order to reach an agreement the U.S. must (1) remove all extra tariffs, (2) set targets for Chinese purchases of goods in line with “real demand”, and (3) ensure that the text of the deal ensures the “dignity” of both nations. Liu’s three conditions underscore the work still to be done if an accord is to be reached between the world’s two largest economies. U.S. Trade Representative Robert Lighthizer said the administration would release details of its plans for tariffs on an additional $300 billion in imports from China early next week.
Japan’s economy likely slowed to a crawl in the first quarter of the year due to a sharp drop in exports to China, according to a survey of private-sector economists. Real gross domestic product likely grew just 0.003% from the previous quarter on an annualized basis, based on the average response from 15 economists. The Japan Research Institute’s Hideki Matsumura stated, “In addition to exports declining because of China’s economic slowdown, a trend in postponing capital investments, especially in the manufacturing sector, has emerged on uncertainty over the global economy.” The surveyed economists said imports decreased about 3%, greater than the fall in exports, thereby improving Japan’s net export position. However, the economists noted this is not necessarily a positive because while it supports Japan’s net export position, it also reflects weak domestic demand.
Finally: With the trade conflict between the U.S. and China dominating recent financial news headlines, many are wondering what exactly it is that the U.S. imports from – and exports to – its biggest trading partner. The U.S. imports many thousands of products from China in practically every conceivable category, ranging from TVs and cell phones to clothing and handbags to industrial chemicals and rare metals. This chart, from MarketWatch.com, shows the top 11 categories of goods, each representing more than $20 billion apiece. By contrast, only one category of US exports to China exceeds $20 billion, and that is mostly from a single company – Boeing. Note also that the 8th largest category of US exports to China is “Waste & Scrap” – the lowest of the low tech – and one at which even China has begun turning up its nose.

(sources: all index return data from Yahoo Finance; Reuters, Barron’s, Wall St Journal, Bloomberg.com, ft.com, guggenheimpartners.com, zerohedge.com, ritholtz.com, markit.com, financialpost.com, Eurostat, Statistics Canada, Yahoo! Finance, stocksandnews.com, marketwatch.com, wantchinatimes.com, BBC, 361capital.com, pensionpartners.com, cnbc.com, FactSet) These are the opinions of WE Sherman and Co and not necessarily those of Cambridge, are for informational purposes only, and should not be construed or acted upon as individualized investment advice.
Securities offered through Registered Representatives of Cambridge Investment Research Inc., a broker-dealer, member FINRA/SIPC. Advisory Services offered through Cambridge Investment Research Advisors, a Registered Investment Adviser. Strategic Investment Partners and Cambridge are not affiliated.
Indices mentioned are unmanaged and cannot be invested into directly. Past performance is no guarantee of future results. All Investing involves risk. Depending on the types of investments, there may be varying degrees of risk. Investors should be prepared to bear loss, including total loss of principal.