
4-29-19 Weekly Market Update
The very big picture:
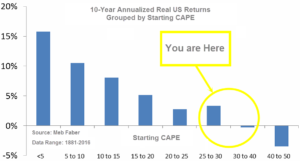
The long-term valuation of the market is commonly measured by the Cyclically Adjusted Price to Earnings ratio, or “CAPE”, which smooths out shorter-term earnings swings in order to get a longer-term assessment of market valuation. A CAPE level of 30 is considered to be the upper end of the normal range, and the level at which further PE-ratio expansion comes to a halt (meaning that increases in market prices only occur in a general response to earnings increases, instead of rising “just because”). The market is currently at that level.
Of course, a “mania” could come along and drive prices higher – much higher, even – and for some years to come. Manias occur when valuation no longer seems to matter, and caution is thrown completely to the wind as buyers rush in to buy first and ask questions later. Two manias in the last century – the 1920’s “Roaring Twenties” and the 1990’s “Tech Bubble” – show that the sky is the limit when common sense is overcome by a blind desire to buy. But, of course, the piper must be paid and the following decade or two are spent in Secular Bear Markets, giving most or all of the mania gains back.

See Fig. 1 for the 100-year view of Secular Bulls and Bears. The CAPE is now at 30.99, up from the prior week’s 30.62, above the level reached at the pre-crash high in October, 2007. Since 1881, the average annual return for all ten year periods that began with a CAPE around this level have been in the 0% – 3%/yr. range. (see Fig. 2).
In the big picture:
The “big picture” is the months-to-years timeframe – the timeframe in which Cyclical Bulls and Bears operate. The U.S. Bull-Bear Indicator (see Fig. 3) is in Cyclical Bull territory at 67.69, up from the prior week’s 66.06.

In the intermediate and Shorter-term picture:
The Shorter-term (weeks to months) Indicator (see Fig. 4) turned negative on March 22nd. The indicator ended the week at 34, unchanged from the prior week. Separately, the Intermediate-term Quarterly Trend Indicator – based on domestic and international stock trend status at the start of each quarter – was positive entering April, indicating positive prospects for equities in the second quarter of 2019.

Timeframe summary:
In the Secular (years to decades) timeframe (Figs. 1 & 2), the long-term valuation of the market is historically too high to sustain rip-roaring multi-year returns. The Bull-Bear Indicator (months to years) remains positive (Fig. 3), indicating a potential uptrend in the longer timeframe. In the intermediate timeframe, the Quarterly Trend Indicator (months to quarters) is positive for Q2, and the shorter (weeks to months) timeframe (Fig. 4) is negative. Therefore, with two indicators positive and one negative, the U.S. equity markets are rated as Neutral.
In the markets:
U.S. Markets: U.S. stocks recorded mixed results for the week with the technology-heavy NASDAQ Composite and smaller-cap indexes outperforming large caps. The S&P 500 Index hit record highs on Tuesday and again on Friday, rising 1.2% for the week. The NASDAQ Composite had its fifth straight week of gains adding 1.9%. The S&P 400 midcap index and small cap Russell 2000 index rose 1.1% and 1.7%, respectively. The Dow Jones Industrial Average, however, finished the week down 16 points, or -0.06%, to 26,543 following a disappointing earnings report from 3M.
International Markets: International markets didn’t fare quite as well as the U.S. Canada’s TSX ended the week flat while the UK’s FTSE 100 fell -0.4%. On Europe’s mainland, France’s CAC finished down -0.2%, Germany’s DAX rose 0.8%, and Italy’s Milan FTSE finished down -1%. In Asia, China’s Shanghai Composite plunged -5%, while Japan’s Nikkei rose 0.8%. As grouped by Morgan Stanley Capital International, developed markets finished down ‑0.3%, while emerging markets gave up -1.5%.
Commodities: After four consecutive weeks of declines, Gold managed a gain of 1% by finishing the week at $1288.80 an ounce. Silver also managed a positive close, rising 0.3% to $15.01 an ounce. Crude oil had its first down week in eight, retreating -1.2% and ending the week at $63.30 per barrel. The industrial metal copper, seen by some analysts as a barometer of global economic health due to its variety of uses, finished the week down ‑0.9%.
U.S. Economic News: The number of Americans claiming first-time unemployment benefits jumped by 37,000 to 230,000 last week, hitting a two-and-a-half month high. However, analysts were quick to note that the surge was likely related to the Easter holiday and spring break. Overall, claims remain near their lowest levels in 50 years. Economists had expected new claims to total 201,000. The four-week average of new claims, which smooths out the volatility of the weekly reading, rose by a smaller 4,500 to 206,000. Continuing claims, which counts the number of people already receiving benefits, rose by 1,000 to 1.66 million. Continuing claims are also near a 50-year low.
Sales of existing homes fell more sharply than expected last month, down 4.9% from February’s pace and missing economists’ estimates of a 5.3 million annual rate. The National Association of Realtors (NAR) reported existing-home sales ran at a seasonally-adjusted annual rate of 5.21 million in March. February’s surge was the strongest in nearly four years, and the NAR is attributing March’s decline to a return to normalcy after that spike. However, overall sales were down 5.4% versus the same time last year. In the details, the median price of a home sold in March was $259,400, up 3.8% from a year ago. In addition, at the current pace of sales there was a 3.9 months available supply of homes on the market, still well below the long-time average of 6 months that analysts use to indicate a “balanced” housing market. All regions saw a decline with sales in the Northeast down 3.9%, the South down 3.4%, the West off by 6%, and the Midwest with the biggest decline—7.9%.
Going in the opposite direction of existing home sales, sales of new homes rose 4.5% in March to a seasonally-adjusted annual rate of 692,000, beating the consensus forecast of a 656,000 rate. After months of stagnation, sales of newly-constructed homes finally gained momentum with March’s sales pace the strongest since November 2017. Year-to-date, sales are running 1.7% higher than from the same period last year. Analysts note that lower prices helped boost sales. The median price of a home sold in March was $302,700, 9.7% lower than the same period a year ago. At the current pace of sales, there is 6 months of available supply on the market.
Orders for goods expected to last at least 3 years, a.k.a. “durable goods”, grew at their fastest rate in over half a year last month as business investment continues to rebound. The Commerce department reported that durable-goods orders rose 2.7% in March, led by stronger demand for vehicles, planes, and networking equipment. Economists had expected only a 0.5% increase. Ex-transportation, orders rose a lesser 0.4%. A key measure of business investment known as core orders also showed strength. Core orders rose 1.3% in March, the third straight monthly increase. These orders, which exclude aircraft and military goods, have risen slightly more than 5% in the past year. Economist Andrew Hollenhorst of Citibank remarked, “A strong increase in core capital goods orders is a positive sign for rising business investment into the second quarter, consistent with our view that 2019 will be another year of solid activity.”
The sentiment of the nation’s consumers slipped this month, according to the University of Michigan. UofM’s consumer sentiment index fell 1.2 points to 97.2 in April, but it remained above analysts’ estimates of 97.0. Most notable in the report was that when respondents were asked their financial prospects for the year ahead, the percent who expect improvement over those who expect worsening finances reached their best level in 15 years. In addition, 60% answered that they expected to be better off financially over the next five years—a 7 year high. Economists from Oxford Economics wrote in a note to clients, “We continue to expect firmer consumer spending momentum ahead, after a soft 1.2% annualized advance in the first quarter. Upbeat consumer expectations continue to point to such a pickup.”
The U.S. economy grew 3.2% in the first quarter of 2019 the Commerce Department reported in its monthly Gross Domestic Product (GDP) report. The gain was well above forecasts of just a 2.3% increase. One factor that led to the increase was a sharp upturn in state and local government spending, which jumped 3.9% after a 1.3% drop in the prior three months. This was the fastest gain in three years. Also fueling the stronger GDP growth were stronger inventory building and trade activity. Analysts note the acceleration in growth in the first quarter is all the more remarkable considering the concern that surrounded the first-quarter outlook in December. Before the new year began, the Atlanta Fed’s “nowcast” GDP model projected just a 0.5% growth, and the flattening of the yield curve was fueling widespread talk of recession. The Federal Reserve is not expected to change its patient approach to interest-rate policy despite the strong report. Officials are expected to wait to see how the economy fares in the second quarter before making any decisions.
International Economic News: The Bank of Canada officially put its rate hike bias on hold amid a slowdown in Canada’s economy. Bank of Canada policymakers left their benchmark overnight interest rate unchanged at 1.75% for a fourth consecutive meeting and dropped a reference to future increases that had been in every rate statement since the end of 2017. The bank cited a series of factors -everything from slower global growth to sluggish housing and oil sectors – for the weaker outlook, which includes a more dour growth forecast for this year than economists are expecting. Markets were largely anticipating the change in stance, pricing in no chance of any more hikes this year while placing small odds on a rate cut. Toronto-Dominion Bank Chief Economist Beata Caranci stated, “The statement tilted dovish, but anything else would have been a disappointment relative to the reality of the data.”
Support for the United Kingdom’s decision to leave the European Union came from an unlikely source this week: German economist Dr. Markus Krall. Dr. Krall threw his support behind Britain’s decision to unshackle itself from the EU, stating the EU was heading for an “economic bomb explosion” and urged the UK to be “far, far away”. Dr. Krall blasted the Union as a “bureaucratic protectionist system”. “The monetary bomb the ECB has created for us is unfortunately pretty big and pretty powerful, also because they have been working on it for a long time. We have witnessed a low and then zero interest rate policy for 12 years and this policy has massively eroded our banking system in the Eurozone.” Dr. Krall said the UK had made a “logical” decision to leave the EU and if was British he would have done the same.
French President Emmanuel Macron has finally given a definitive response to the “yellow vest” movement, a series of wide-spread, sometimes violent, protests across France. The protests were originally sparked by Macron’s planned steep fuel tax hike to fund eco-friendly projects, but evolved to include his wider policies. To assuage the protestors Macron announced that he planned to institute higher tax cuts, higher pensions, reform of the civil service, and abolition of the ENA University which has trained political leaders and heads of industry since 1945 but is seen now as elitist. Although he questioned in his speech whether he had taken a “wrong turn”, he insisted that government reforms so far had been right, but not fast enough.
Business morale in Germany fell according to figures released this week in the latest sign of a weakening German economy. The Munich-based Ifo Economic Institute said its business climate index fell to 99.2 this month, missing expectations by 0.7 point. The reading was also down half a point from March. Ifo President Clemens Fuest said in a statement: “March’s gentle optimism regarding the coming months has evaporated. The German economy continues to lose steam.” As the Eurozone’s manufacturing powerhouse, Germany has been hit particularly hard by slowing global demand. Ifo economist Klaus Wohlrabe said, “Pessimism is increasing. The industrial sector is dragging down the German economy.”
China’s long-term GDP is projected to fall 3.25% – 3.5% by investment research firm Morningstar. That would be about half the current growth rate of 6.3% the International Monetary Fund calculates. Morningstar researchers also expect the China-U.S. trade dispute will expand in complexity, ushering in “a new era of power conflict, one in which the U.S. seeks to use all available economic means to curb China’s rise”—including cutting off all trade in a worst-case scenario. As Morningstar points out, trade is not the only area of contention. China’s industrial policy has led to the creation of new tech companies that rival U.S. and European companies not only in China, where many of the U.S. and European companies are not allowed to participate, but also throughout Asia.
Japan’s central bank announced that it now believes the nation will fail to reach its 2% inflation target by 2022. In its quarterly report, the Bank of Japan forecast inflation of 1.6% in the fiscal year ending March 2022 and revised down its inflation forecast for 2021 to 1.3% from 1.4%. Japanese inflation currently stands below one percent, less than halfway to its target, despite six years of aggressive monetary stimulus under BOJ Governor Haruhiko Kuroda. The central bank kept its ultra-loose monetary policy in place after a two-day policy board meeting but added a fresh time frame, saying the “extremely low” rates would be maintained “at least through spring 2020”. The BOJ left the short-term interest rate at minus 0.1% and long-term rates around zero.
Finally: After the release of last week’s impressive GDP headline of 3.2%, some analysts noted that a deeper look beyond the headline number revealed that not all the innards were was as rosy as the headline. Harvard Professor Jason Furman noted that “The underlying trend of consumption and investment is weakening.” In fact, private-sector consumption and investment slowed to just a 1.3% annual rate in the first quarter, the slowest in nearly six years. Furthermore, consumer spending rose only 1.2% in the first quarter, after healthy 2.5% growth the previous quarter, and spending on durable goods plunged 5.3%, the worst since 2009. Professor Furman notes that the 3.2% GDP reading was deceptively boosted by several one-off factors—improvement in the trade balance, a large build-up in inventories and higher spending by state and local governments. The private-sector slowdown is illustrated by the following chart, from Haver Analytics.

(sources: all index return data from Yahoo Finance; Reuters, Barron’s, Wall St Journal, Bloomberg.com, ft.com, guggenheimpartners.com, zerohedge.com, ritholtz.com, markit.com, financialpost.com, Eurostat, Statistics Canada, Yahoo! Finance, stocksandnews.com, marketwatch.com, wantchinatimes.com, BBC, 361capital.com, pensionpartners.com, cnbc.com, FactSet) ) These are the opinions of WE Sherman and Co and not necessarily those of Cambridge, are for informational purposes only, and should not be construed or acted upon as individualized investment advice.
Securities offered through Registered Representatives of Cambridge Investment Research Inc., a broker-dealer, member FINRA/SIPC. Advisory Services offered through Cambridge Investment Research Advisors, a Registered Investment Adviser. Strategic Investment Partners and Cambridge are not affiliated.
Indices mentioned are unmanaged and cannot be invested into directly. Past performance is no guarantee of future results. All Investing involves risk. Depending on the types of investments, there may be varying degrees of risk. Investors should be prepared to bear loss, including total loss of principal