
5-22-2023 Weekly Market Update
The very Big Picture
The long-term valuation of the market is commonly measured by the Cyclically Adjusted Price to Earnings ratio, or “CAPE”, which smooths-out shorter-term earnings swings in order to get a longer-term assessment of market valuation. A CAPE level of 30 is considered to be the upper end of the normal range, and the level at which further PE-ratio expansion comes to a halt (meaning that further increases in market prices only occur as a general response to earnings increases, instead of rising “just because”). The market was recently above that level, and has fallen back.
Of course, a “mania” could come along and drive prices higher – much higher, even – and for some years to come. Manias occur when valuation no longer seems to matter, and caution is thrown completely to the wind – as buyers rush in to buy first, and ask questions later. Two manias in the last century – the “Roaring Twenties” of the 1920s, and the “Tech Bubble” of the late 1990s – show that the sky is the limit when common sense is overcome by a blind desire to buy. But, of course, the piper must be paid, and the following decade or two were spent in Secular Bear Markets, giving most or all of the mania-gains back.
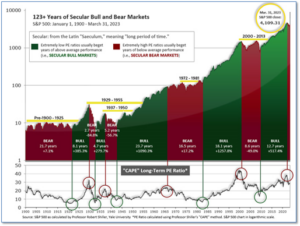
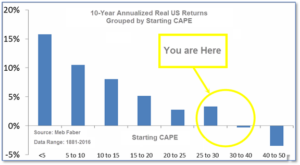
See Fig. 1 for the 100-year view of Secular Bulls and Bears. The CAPE is now at 29.38, up from the prior week’s 28.91. Since 1881, the average annual return for all ten-year periods that began with a CAPE in this range has been slightly positive to slightly negative (see Fig. 2).
Note: We do not use CAPE as an official input into our methods. However, if history is any guide – and history is typically ‘some’ kind of guide – it’s always good to simply know where we are on the historic continuum, where that may lead, and what sort of expectations one may wish to hold in order to craft an investment strategy that works in any market ‘season’ … whether the current one, or one that may be ‘coming soon’!
The Big Picture:
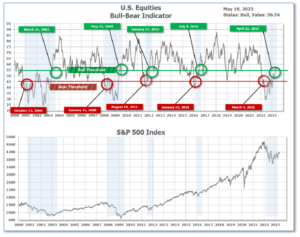
The ‘big picture’ is the (typically) years-long timeframe – the timeframe in which Cyclical Bulls and Bears operate. The U.S. Bull-Bear Indicator finished the week in Bull territory at 56.54, up from the prior week’s 54.62.
In the Quarterly- and Shorter-term Pictures
The Quarterly-Trend Indicator based on the combination of U.S. and International Equities trend-statuses at the start of each quarter – was Positive entering April, indicating positive prospects for equities in the second quarter.
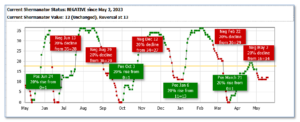
Next, the short-term(weeks to months) Indicator for US Equities turned positive on March 21, and ended the week at 12, up from the prior week’s 11.
In the Markets:
U.S. Markets: Stocks recorded solid gains for the week, with the benchmark S&P 500 Index breaching the 4,200 level in intraday trading for the first time since late August. The Dow Jones Industrial Average added 126 points finishing the week at 33.427, a gain of 0.4%. The technology-heavy NASDAQ Composite rallied 3% closing at 12,659. By market cap, the large cap S&P 500 gained 1.6%, the mid cap S&P 400 added 1%, and the small cap Russell 2000 rebounded 1.9%.
International Markets: International markets finished the week predominantly to the upside as well. Canada’s TSX ticked down -0.3% and the United Kingdom’s FTSE 100 finished flat, but France’s CAC 40 and Germany’s DAX gained 1% and 2.3% respectively. In Asia, China’s Shanghai Composite ticked up 0.3%. Japan’s Nikkei surged 4.8%–it’s sixth consecutive week of gains. As grouped by Morgan Stanley Capital International, developed markets added 0.7%. Emerging markets finished up 1.1%.
Commodities: Precious metals pulled back for a second week. Gold retreated -1.9% to $1981.60 per ounce, while Silver gave up -0.4% finishing the week at $24.06. The industrial metal copper, viewed by some analysts as a barometer of world economic health due to its wide variety of uses, ticked up 0.1%. Oil rebounded after four consecutive weeks of declines. West Texas Intermediate crude rose 2.4% to $71.69 per barrel.
U.S. Economic News: The number of Americans filing for first-time unemployment benefits fell sharply last week, presumably due to the state of Massachusetts cracking down on a recent spike in fraudulent claims. The Labor Department reported initial jobless claims fell by 24,000 to 242,000. Thirty-five of the 53 U.S. states and territories that report jobless claims showed a decrease in the week ended May 15. Eighteen posted an increase. While Massachusetts ranks 13th among the states in total number of employees, it’s recently been reporting the second-highest number of new claims among all states. Meanwhile, continuing claims, which counts the number of people already receiving benefits dipped by 8,000 to 1.8 million.
Confidence among the nation’s homebuilders rose for a fifth consecutive month amid an ongoing shortage of homes available for sale. The National Association of Homebuilders (NAHB) reported their monthly confidence index rose 5 points to 50 this month. The slight rise exceeded Wall Street expectations. The May reading was the strongest since July of 2022. At this time last year, the index stood at 69. Builders were optimistic about the future as buyers continue to deal with a shortage of homes for sale on the market, which is in part a consequence of millions of homeowners refinancing their mortgage to ultra-low rates during the pandemic. “With limited available housing inventory, new construction will continue to be a significant part of prospective buyers’ search in the quarters ahead,” Robert Dietz, chief economist at the NAHB, said in its statement.
Manufacturing activity in the New York-region slowed significantly this month, according to the New York Federal Reserve. The regional Fed bank reported its Empire State Business-conditions index plummeted 42.6 points to -31.8. It was the largest monthly decline since the start of the pandemic. The reading was far below the consensus forecast of a -5 reading. In the report, the index for new orders dropped 53.1 points to -28, completely reversing April’s sharp 46.7-point gain. Furthermore, the shipments index fell 40.3 points to -16.4. Mickey Levy, chief economist for Americas and Asia at Berenberg Capital Markets wrote in a note, “This reinforces our expectation that manufacturing production and industrial output are likely to soften materially through year-end as demand slows.”
Sales at the nation’s retailers rebounded 0.4% last month boosted by strong demand for new autos and higher consumer spending online. The reading lagged the consensus forecast of a 0.8% rise. Retail sales are a big part of consumer spending and offer a valuable clue about the strength of the economy. Before April’s increase, retail sales had fallen in four out of the last five months. Excluding auto dealers and gasoline, retail sales were up a somewhat stronger 0.6%–big ticket purchases like vehicles can exaggerate overall retail spending data. Senior economist Sal Guatieri of BMO Capital Markets said, “Consumer spending is downshifting but not contracting, despite high borrowing costs and tighter borrowing standards.”
The Leading Economic Index (LEI), a collection of ten indicators designed to anticipate changes in the U.S. economy, fell for the 13th month in a row pointing once again to a potential recession later this year. The LEI fell -0.6% last month, matching forecasts. The economy has slowed in response to higher interest rates. Analysts note the leading index has been signaling a recession for months, and there’s still little sign of one. Justyna Zabinska-La Monica, senior manager of business cycle indicators at the Conference Board wrote in the release, “The Conference Board forecasts a contraction of economic activity starting in the second quarter, leading to a mild recession by mid-2023.”
International Economic News: The World Travel & Tourism Council’s 2023 Economic Impact Research (EIR) report revealed the Canadian Travel & Tourism sector continues to show strong signs of post-pandemic recovery. According to the latest EIR, the sector is set to contribute $162.6 billion to the Canadian economy this year, up 17.2% from last year and near its previous peak of $173.9 billion in 2019. WTTC is also forecasting that Travel & Tourism will create 90,000 jobs this year, recovering almost all of the jobs lost due to the COVID-19 pandemic. Last year saw the return of international travelers heading to Canada, with spending from overseas visitors growing 64% to reach almost $23 billion. However, this is still only roughly half of the 2019 peak of $42.9 billion.
Across the Atlantic, Bank of England Governor Andrew Bailey admits the United Kingdom is suffering from a “wage-price spiral”. Speaking to the British Chambers of Commerce annual conference in London, the BoE governor said the UK was experiencing “second-round” effects of inflation, highlighting the spread of rapid price rises from energy and food into generalized wage and price setting by companies. Furthermore, he pledged to lift interest rates as far “as necessary” to get inflation back to the bank’s 2% target. The BoE has repeatedly said over the past 18 months that it was trying to stop the risk of high energy and food costs affecting domestic wages and prices. It has now admitted it failed in that task.
More than 200 chief executives from around the world attended France’s flagship investment conference “Choose France” in Versailles. Approximately €13 billion worth of future investments in France were pledged by international companies, as part of 28 company-specific projects across health, transport and energy sectors, amounting to 8,000 new jobs. “France is THE foreign investors’ destination in Europe. Our economic and fiscal policy is paying off,” Economy Minister Bruno Le Maire stated. It is the fourth year in a row that France scores as the number one destination in Europe for foreign direct investments, according to an annual study by consultancy firm Ernst & Young.
Germany’s ZEW economic sentiment indicator slipped 14.8 points to -10.7 this month, marking its first negative reading since December of 2022. “The ZEW Indicator of Economic Sentiment has once again fallen sharply. The financial market experts anticipate a worsening of the already unfavorable economic situation in the next six months. As a result, the German economy could slip into a recession, albeit a mild one,” ZEW President Achim Wambach stated. The decline is partly due to expectations of further interest rate hikes by the European Central Bank, he added.
In Asia, China’s economic data for April broadly missed expectations as its economy continued to show an uneven path of recovery from its stringent COVID restrictions. Industrial production for April rose by 5.6% year-on-year, compared to the 10.9% expected by economists, while retail sales rose by 18.4%, missing the consensus forecast of a 21% increase. Bank of America Securities China equity strategist Winnie Wu isn’t expecting a turnaround in China anytime soon. Wu stated, “The recovery of income, of job security, and confidence will take time.”
Japan’s economy grew at an annual rate of 1.6% in the first quarter as private demand rebounded after COVID restrictions were lifted. Real gross domestic product grew 0.4% in January-March in the world’s third largest economy, the government Cabinet Office said. That was the strongest GDP growth pace since the second quarter of 2022, which showed 1.1% growth. It was also better than the market consensus forecast of 0.2%. The biggest contributor to growth was private demand, surging an annual 3.1%, with consumer spending and private investment showing a healthy rebound. The recent opening of borders to tourists and other incoming travel has also helped consumption perk up.
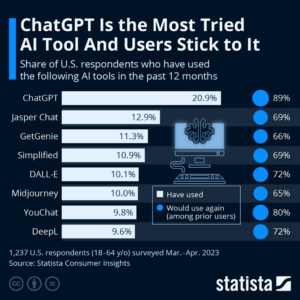
Finally: With the release of ChatGPT in November of 2022, artificial intelligence (AI) tools have become all the rage. While there have been releases of AI-powered tools before OpenAI released ChatGPT to the public, none of them gained as much public attention. ChatGPT was the first generative AI tool to reach mass adoption, with more than a million people registering to use it within days of its release. According to a survey conducted by Statista Consumer Insights, 20 percent of U.S. respondents had tried ChatGPT by the time the survey was fielded in March and April 2023, putting it far ahead of other AI tools such as Jasper Chat, GetGenie or Simplified.
(Sources: All index- and returns-data from Norgate Data and Commodity Systems Incorporated; news from Reuters, Barron’s, Wall St. Journal, Bloomberg.com, ft.com, guggenheimpartners.com, zerohedge.com, ritholtz.com, markit.com, financialpost.com, Eurostat, Statistics Canada, Yahoo! Finance, stocksandnews.com, marketwatch.com, wantchinatimes.com, BBC, 361capital.com, pensionpartners.com, cnbc.com, FactSet.) Content provided by WE Sherman and Company. Securities offered through Registered Representatives of Cambridge Investment Research Inc., a broker-dealer, member FINRA/SIPC. Advisory Services offered through Cambridge Investment Research Advisors, a Registered Investment Adviser. Strategic Investment Partners and Cambridge are not affiliated. Indices mentioned are unmanaged and cannot be invested into directly. Past performance is no guarantee of future results. These opinions of Strategic Investment Partners and not necessarily those of Cambridge Investment Research, are for informational purposes only and should not be construed or acted upon as individualized investment advice.