
4-9-18 Market Update
4-9-18 Market Update
The very big picture:
In the “decades” timeframe, the current Secular Bull Market could turn out to be among the shorter Secular Bull markets on record. This is because of the long-term valuation of the market which, after only eight years, has reached the upper end of its normal range.
The long-term valuation of the market is commonly measured by the Cyclically Adjusted Price to Earnings ratio, or “CAPE”, which smooths out shorter-term earnings swings in order to get a longer-term assessment of market valuation. A CAPE level of 30 is considered to be the upper end of the normal range, and the level at which further PE-ratio expansion comes to a halt (meaning that increases in market prices only occur in a general response to earnings increases, instead of rising “just because”).
Of course, a “mania” could come along and drive prices higher – much higher, even – and for some years to come. Manias occur when valuation no longer seems to matter, and caution is thrown completely to the wind as buyers rush in to buy first and ask questions later. Two manias in the last century – the 1920’s “Roaring Twenties” and the 1990’s “Tech Bubble” – show that the sky is the limit when common sense is overcome by a blind desire to buy. But, of course, the piper must be paid and the following decade or two are spent in Secular Bear Markets, giving most or all of the mania gains back.
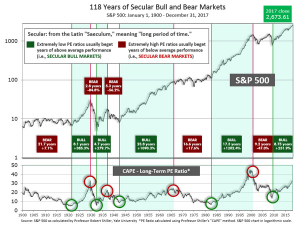
See Fig. 1 for the 100-year view of Secular Bulls and Bears. The CAPE is now at 31.34, down from the prior week’s 31. 79, and still exceeds the level reached at the pre-crash high in October, 2007. This value is in the lower end of the “mania” range. Since 1881, the average annual return for all ten year periods that began with a CAPE around this level have been in the 0% – 3%/yr. range. (see Fig. 2).

In the big picture:
The “big picture” is the months-to-years timeframe – the timeframe in which Cyclical Bulls and Bears operate. The U.S. Bull-Bear Indicator (see Fig. 3) is in Cyclical Bull territory at 65.75, down from the prior week’s 68.34.

In the intermediate and Shorter-term picture:
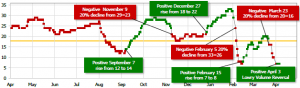
The Shorter-term (weeks to months) Indicator (see Fig. 4) turned positive on April 3rd. The indicator ended the week at 7, down from the prior week’s 10. Separately, the Intermediate-term Quarterly Trend Indicator – based on domestic and international stock trend status at the start of each quarter – was negative entering April, indicating poor prospects for equities in the second quarter of 2018.
Timeframe summary:
In the Secular (years to decades) timeframe (Figs. 1 & 2), the long-term valuation of the market is simply too high to sustain rip-roaring multi-year returns – but the market has entered the low end of the “mania” range, and all bets are off in a mania. The only thing certain in a mania is that it will end badly…someday. The Bull-Bear Indicator (months to years) is positive (Fig. 3), indicating a potential uptrend in the longer timeframe. In the intermediate timeframe, the Quarterly Trend Indicator (months to quarters) is negative for Q2, and the shorter (weeks to months) timeframe (Fig. 4) is positive. Therefore, with two indicators positive and one negative, the U.S. equity markets are rated as Neutral.
In the markets:
U.S. Markets: Growing tensions between China and the United States exacerbated fears of an all-out trade war between the world’s top two economies. China announced that it would retaliate for the U.S. tariffs on steel and aluminum with new tariffs on its own targeting roughly 130 U.S. products. The U.S. countered with an additional list of proposed tariffs on 1,300 Chinese products. The tit-for-tat escalation led the Dow Jones Industrial Average to a -170 point loss for the week closing at 23,932. The technology-heavy NASDAQ Composite suffered a steeper -2.1% decline ending the week at 6.915. By market cap, small caps showed slight relative strength with the small cap Russell 2000 ending down -1.05%, while the large cap S&P 500 and mid cap S&P 400 retreated ‑1.4% and ‑1.3%, respectively.
International Markets: Canada’s TSX retraced all of last week’s gain falling -1%. Across the Atlantic, the United Kingdom’s FTSE had a second strong week of gains, rising 1.8%. On Europe’s mainland, major markets were green across the board. France’s CAC 40 added 1.8%, Germany’s DAX gained 1.2%, and Italy’s Milan FTSE surged 2.3%. In Asia, markets were mixed. China’s Shanghai Composite retreated -0.9%, while Japan’s Nikkei followed last week’s strong performance with an additional 1.9% gain. Hong Kong’s Hang Seng Index finished down -0.8%. As grouped by Morgan Stanley Capital International, developed markets finished down -0.4% despite Europe’s gains, and emerging markets fell -2.5%.
Commodities: As a safe-haven from all the volatility in the stock market, investors flocked to precious metals for refuge. Gold rose 0.7%, or $8.80 an ounce ending the week at $1336.10. Similarly, silver added 0.6% to close at $16.36 an ounce. The industrial metal copper, viewed as a barometer of global economic health due to its variety of uses, gained 1.2% last week. Energy, however, had its second week of losses falling over -4.4%. West Texas Intermediate crude oil fell -$2.88 per barrel, ending the week at $62.06. Brent North Sea crude oil finished down -3.2% finishing trading at $67.11 a barrel.
U.S. Economic News: The Labor Department said the number of Americans seeking new unemployment benefits jumped by 24,000 to 242,000 last week, but remained near historically low levels. Analysts consider readings below 300,000 as indicative of a “healthy” jobs market. The more stable monthly average of new claims, used to “iron out” the volatility of the weekly number, rose a much smaller 3,000 to 228,250. The number of people already receiving unemployment benefits, so-called continuing claims, fell by 64,000 to 1.81 million. That reading is at its lowest level since the end of 1973. Claims have been below the key 300,000 threshold for 161 consecutive weeks, the longest stretch since the late 1960’s. The unemployment rate remained unchanged at 4.1%.
Hiring in the private-sector rose in March, according to payrolls processor ADP. Private employers expanded their workforce by a seasonally-adjusted 241,000 last month, well above economists’ forecasts of 185,000 jobs. It was the fifth consecutive gain above 200,000. In the details of the report, the professional and business services, trade, transportation and utilities sectors posted the largest hiring gains, followed by construction and manufacturing. By company size, small firms added 47,000 positions, while medium-sized and large companies added 127,000 and 67,000 jobs respectively.
Manufacturing growth in March was its strongest in three years, according to research firm IHS Markit. The March U.S. Manufacturing Purchasing Managers’ Index (PMI) conducted by Markit came in at 55.6 last month, 0.3 up from February’s final reading. Chris Williamson, Chief Business Economist at IHS Markit stated, “US factories reported a strong end to the first quarter, with the PMI advancing to a three-year high. The goods producing sector should therefore make a positive contribution to economic growth in the first quarter, as rising demand fueled further improvements in factory production.”
In a separate survey, the Institute for Supply Management’s (ISM) Manufacturing Report increased at a slower pace last month. ISM’s manufacturing index came in at 59.3 in March, a 1.5 point decrease from the previous month and missing forecasts of 60.1. Still, the index indicates expansion in manufacturing as readings above 50 indicate growth. The survey’s production sub-index fell 1.0 point while the gauge of new orders dropped to 61.9 from 64.2. A measure of factory employment dropped 2.4 points to 57.3. Seventeen industries surveyed all reported growth last month while only one – apparel, leather and allied products – reported a decrease. Manufacturing accounts for about 12% of the U.S. economy.
Business activity in the service sector slowed in March but remained healthy according to a pair of reports. IHS Markit’s U.S. Services PMI dropped 1.9 points to 54 in March, however output growth remained solid. In addition, the index average for the first quarter of the year was consistent with the overall pace of growth last year. Separately, the ISM survey of non-manufacturing firms down ticked to 58.8 last month, less than the 59 expected. ISM’s survey showed that growth slowed for the second month in a row, but remained in expansion above 50. According to ISM’s index, the service sector has seen continued expansion for 98 consecutive months. In ISM’s survey, fifteen of the seventeen non-manufacturing industries reported growth, with the two industries reporting contraction being educational services and information.
Construction spending rose less than expected in February, due to a steep decline in investment in public construction projects. The Commerce Department said spending edged up just 0.1% after being unchanged in January. Economists had forecast spending accelerating to 0.5%. Year-over-year construction spending is up 3%. Across the nation, federal government construction projects plunged 11.9% following a 13.4% surge in January, while state and local government construction spending fell 1%. Spending on private construction projects increased 0.7%, with private residential projects rising 0.1% to their highest level since January 2007.
International Economic News: The trade deficit in Canada widened in February on the heels of the highest imports of energy products in more than three years. Canada posted a trade deficit of 2.69 billion Canadian dollars ($2.10 billion) according to Statistics Canada, exceeding forecasts of 2.1 billion CAD. The report came amid a renewed push to conclude negotiations on the North American Free Trade Agreement, which U.S. and Mexican officials are anxious to wrap up ahead of Mexico’s presidential election and mid-term elections in the U.S. The weaker trade data means another interest rate hike before summer by Canada’s central bank is unlikely. TD Bank economist Dina Ignjatovic said, “With the Bank of Canada in data-dependent mode, this morning’s report is not going to do much to pull them off the sidelines.” The Bank of Canada raised its key interest rate three times over the past year, bringing it to 1.25%. Officials said recently that they would be cautious in considering future rate increases, in part because of uncertainty over global trade policy.
The freezing weather in the United Kingdom was to blame for the “iced up” economy according to the latest data from research firm IHS Markit. Markit’s Purchasing Managers Index (PMI) for services slipped 2.8 points to 51.7 in March, weighed down by heavy snow and weak consumer demand. The reading was its lowest since July 2016. In the first quarter, Britain’s economy grew at a quarterly rate of just below 0.3%, down from 0.4% at the end of 2017, IHS Markit said. Chris Williamson, IHS Markit’s chief business economist said, “The UK economy iced up in March, suffering the weakest increase in business activity since the Brexit vote amid widespread disruptions caused by some of the heaviest snowfall in years.” A Siberian weather system that meteorologists called “the Beast from the East” brought rare snow and sub-zero temperatures to much of Britain in late February and early March.
France’s finance minister pledged this week to push ahead with President Emmanuel Macron’s drive to modernize the economy despite the recent strikes by public transportation workers that have crippled train transport. Bruno Le Maire dug in his heels, saying that the government would not pull back from economic reforms he asserted had helped make 2017 the best year for foreign corporate investment in France in over 16 years. Nearly 1,300 foreign investments last year helped create 33,489 French jobs, according to Business France, while total foreign investment rose 16 percent from 2016. France’s high taxes and strict labor laws have long hurt its image with foreign investors, although that has changed some after Macron made it easier to hire and fire workers and committed to cutting corporate tax rates to the EU average.
Europe’s export powerhouse Germany had an unexpected sign of weakness as the country’s economics ministry recorded a 1.6% drop in industrial output in February compared with January. The reading came as a big surprise, as economists were expecting a 0.3% increase. While some of the weakness may have been due to temporary factors such as unusually cold weather and a strike by the powerful IG Metall labor union (that has now been resolved), other factors point to a more durable problem. Recent surveys of purchasing managers report that businesses continue to experience shortages of skilled workers and needed materials, suggesting the German economy can’t continue its rapid growth rate for long.
Profits at China’s largest publicly listed companies increased at their fastest clip since 2010 last month, but the outlook for the remained of this year isn’t as bright. Earnings per share of companies in the MSCI China Index (152 large and midcap Chinese stocks) increased about 26% last year according to research firm Nomura. The main drivers were big tech companies like Alibaba Group Holdings and Tencent Holdings. However, China’s government has been cracking down on speculative investing, off-balance sheet lending, and excessive leverage which will weigh on profit margins and growth for some high-flying companies. In addition, a brewing trade war with the United States will almost certainly have an impact should it actually come to pass.
Japan and China scheduled their first high-level economic talks in more than 8 years later this month as both countries look forward to promoting better bilateral ties ahead of a three-way summit with South Korea scheduled in May. Chinese Foreign Minister Wang Yi plans to visit Japan later this month to discuss cooperation on China’s Belt and Road Initiative as well as trade and investment with his Japanese counterpart Taro Kono. Also attending will be Chinese Commerce Minister Zhong Shan and Finance Minister Liu Kun. The leaders of the two countries will also discuss cooperation on the “free and open indo-Pacific” strategy championed by Japanese Prime Minister Shinzo Abe.
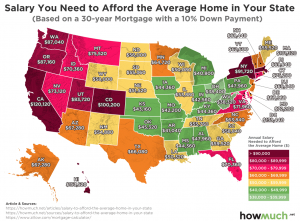
Finally: How much income do you need to afford the average home in your state? The answer, which may surprise you, comes from finance website howmuch.net. Most of the nation’s housing markets have now almost completely recovered back to pre-housing-bubble levels, with many markets far surpassing those peaks. Howmuch.net collected average home prices for every state from Zillow, and then plugged the numbers into a typical mortgage calculator.
The states needing the highest salaries to afford the average home start with Hawaii at $153,520, followed by Washington D.C., California, Massachusetts, and Colorado. The states with lowest salaries needed to afford the average home include West Virginia at just $38,320 followed by Ohio, Michigan, Arkansas, and Missouri.
(sources: all index return data from Yahoo Finance; Reuters, Barron’s, Wall St Journal, Bloomberg.com, ft.com, guggenheimpartners.com, zerohedge.com, ritholtz.com, markit.com, financialpost.com, Eurostat, Statistics Canada, Yahoo! Finance, stocksandnews.com, marketwatch.com, wantchinatimes.com, BBC, 361capital.com, pensionpartners.com, cnbc.com, FactSet)
Indices mentioned are unmanaged and cannot be invested into directly. Past performance is no guarantee of future results. All Investing involves risk. Depending on the types of investments, there may be varying degrees of risk. Investors should be prepared to bear loss, including total loss of principal.