
4-2-18 Market Update
4-2-2018 Market Update
The very big picture:
In the “decades” timeframe, the current Secular Bull Market could turn out to be among the shorter Secular Bull markets on record. This is because of the long-term valuation of the market which, after only eight years, has reached the upper end of its normal range.
The long-term valuation of the market is commonly measured by the Cyclically Adjusted Price to Earnings ratio, or “CAPE”, which smooths out shorter-term earnings swings in order to get a longer-term assessment of market valuation. A CAPE level of 30 is considered to be the upper end of the normal range, and the level at which further PE-ratio expansion comes to a halt (meaning that increases in market prices only occur in a general response to earnings increases, instead of rising “just because”).
Of course, a “mania” could come along and drive prices higher – much higher, even – and for some years to come. Manias occur when valuation no longer seems to matter, and caution is thrown completely to the wind as buyers rush in to buy first and ask questions later. Two manias in the last century – the 1920’s “Roaring Twenties” and the 1990’s “Tech Bubble” – show that the sky is the limit when common sense is overcome by a blind desire to buy. But, of course, the piper must be paid and the following decade or two are spent in Secular Bear Markets, giving most or all of the mania gains back.

See Fig. 1 for the 100-year view of Secular Bulls and Bears. The CAPE is now at 31.79, up slightly from the prior week’s 31.68, and still exceeds the level reached at the pre-crash high in October, 2007. This value is in the lower end of the “mania” range. Since 1881, the average annual return for all ten year periods that began with a CAPE around this level have been in the 0% – 3%/yr. range. (see Fig. 2).

In the big picture:
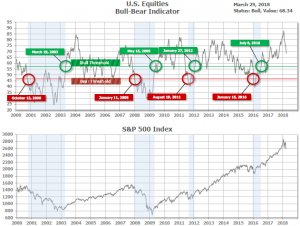
The “big picture” is the months-to-years timeframe – the timeframe in which Cyclical Bulls and Bears operate. The U.S. Bull-Bear Indicator (see Fig. 3) is in Cyclical Bull territory at 68.34, down from the prior week’s 70.17.
In the intermediate and Shorter-term picture:
The Shorter-term (weeks to months) Indicator (see Fig. 4) turned negative on March 23rd. The indicator ended the week at 10, down from the prior week’s 16. Separately, the Intermediate-term Quarterly Trend Indicator – based on domestic and international stock trend status at the start of each quarter – was negative entering April, indicating poor prospects for equities in the second quarter of 2018.

Timeframe summary:
In the Secular (years to decades) timeframe (Figs. 1 & 2), the long-term valuation of the market is simply too high to sustain rip-roaring multi-year returns – but the market has entered the low end of the “mania” range, and all bets are off in a mania. The only thing certain in a mania is that it will end badly…someday. The Bull-Bear Indicator (months to years) is positive (Fig. 3), indicating a potential uptrend in the longer timeframe. In the intermediate timeframe, the Quarterly Trend Indicator (months to quarters) is negative for Q2, and the shorter (weeks to months) timeframe (Fig. 4) is negative. Therefore, with one indicator positive and two negative, the U.S. equity markets are rated as Neutral.
In the markets:
U.S. Markets: U.S. stocks recovered a portion of the previous week’s steep losses, but the high-flying technology sector lagged the other benchmarks in this partial recovery. The Dow Jones Industrial Average climbed 570 points to close at 24,103, a gain of 2.4%. The technology-heavy NASDAQ Composite added 70 points to end the week at 7,063, a 1.0% rise. By market cap, the large cap S&P 500 index rebounded 2.0%, the mid cap S&P 400 index gained 2.1%, and the small cap Russell 2000 index rose 1.3%.
International Markets: Most world markets also recovered portions of their March losses. Canada’s TSX gained 0.9% this week, and the United Kingdom’s FTSE which added 2.0%. On Europe’s mainland, major markets also finished the week in the green with the CAC 40 adding 1.4%, Germany’s DAX rising 1.8%, and Italy’s Milan FTSE up 0.6%. In Asia, China’s Shanghai Composite rose 0.3%, and Japan’s Nikkei gained 2.6%. As grouped by Morgan Stanley Capital International, emerging markets rose 3.0%, while developed markets added 2.6%.
Commodities: Precious metals gave up some of last week’s gains with Gold falling -1.7% to close at $1327.30. Silver retreated -1.9%, closing at $16.27 an ounce. Energy pulled back -1.4% with West Texas Intermediate crude closing at $64.94 per barrel. Copper, viewed by some analysts as a barometer of world economic health due to its variety of industrial uses, added 1.1%.
March Summary: The Dow Jones Industrial Average lost 926 points, or -3.7%, while the NASDAQ Composite gave up 209 points, a -2.9% decline. By market cap, the S&P 500 retreated -2.7%, the mid cap S&P 400 gained 0.8%, and the small cap Russell 2000 rose 1.1%. Major international markets were down across the board in March. Canada’s TSX fell half a percent, the UK’s FTSE fell -2.4% and France’s CAC 40 declined -2.9%. Germany’s DAX fell ‑2.7% and Italy’s Milan FTSE dropped -0.9%. In Asia, the Shanghai Composite fell -3.0% while Japan’s Nikkei lost -4.0%. As grouped by Morgan Stanley Capital International, emerging markets rose 0.5% in March, while developed markets fell -0.8%. Precious metals were mixed in March. Gold rose 0.7%, while Silver fell -0.9%. Oil added 5.4% and copper ended the month down -3.4%.
Q1 Summary: For the first quarter, the Dow Jones Industrial Average fell 616 points or -2.5%, while the NASDAQ Composite gained 2.3%. The S&P 500 and S&P 400 each declined -1.2%, while the small cap Russell 2000 fell just ‑0.4%. World markets were mixed for the quarter, but the bigger markets were all down. The Canada’s TSX fell -5.2%, the UK’s FTSE 100 lost -8%, while France and Germany lost -2.7% and -6.4%, respectively. The Shanghai Composite ended the quarter down -4.4%, while Japan’s Nikkei lost -7.1%. As grouped by Morgan Stanley Capital International, emerging markets added 1.2% in the first quarter, while developed markets retreated -0.6%. Gold gained 1.1%, Silver added 9.8%, and Oil rallied 7.7%.
U.S. Economic News: The number of claims for initial unemployment benefits fell 12,000 to 215,000 last week, hitting their lowest level since 1973. Economists had forecast claims to total 230,000. The more stable monthly average of claims eased by 500 to 224,500. Claims fell throughout most of the country with the biggest declines coming from the largest states: California, Texas, New York, New Jersey, and Virginia. The labor market is extremely strong with the unemployment rate down to 4.1%, the lowest in 17 years. Companies continue to report trouble finding skilled workers, and remain reluctant to let trained employees go. Continuing claims, the number of people already receiving benefits, rose by 35,000 to 1.87 million. That number is reported with a one-week delay.
U.S. home prices are still on fire according to the latest data from S&P/Case-Shiller. The S&P/Case-Shiller national home price index rose a seasonally-adjusted 0.5% in the final quarter of last year, and was up 6.2% compared to the same time the year before. The more narrowly-focused 20-city index rose a seasonally-adjusted 0.8% for the month, and was up 6.4% for the year. The West continued to have the hottest housing markets with Seattle, Las Vegas, and San Francisco all notching double-digit yearly price gains. Only one city, Washington D.C., had a negative reading. David Blitzer, chairman of the Index Committee at S&P Dow Jones noted the price gains are all about high demand and low supply. “The current months-supply — how many months at the current sales rate would be needed to absorb homes currently for sale — is 3.4; the average since 2000 is 6.0 months, and the high in July 2010 was 11.9,” Blitzer wrote.
The National Association of Realtors (NAR) reported its index of pending-home sales rose 3.1% to 107.5 in February, exceeding forecasts by 0.1%. NAR’s index tracks the number of real-estate transactions in which a contract has been signed but not yet closed, and is used by analysts as an indicator of future home sales. The reading fell to a more-than three year low in January before last month’s rebound. Overall, the index is still 4.1% lower than its level a year ago, though NAR noted that last February’s reading was the second-highest in over 10 years. By region, pending sales surged 10.3% in the Northeast, ticked up 0.7% in the Midwest, rose 3% in the South, and added 0.4% in the West.
The Chicago Fed’s national manufacturing index showed factory activity led the economy’s growth in February. Along with the big recovery in manufacturing, strong hiring and housing activity also contributed to the increase. The Chicago Fed’s index of national economic activity hit a reading of 0.88 last month following a downwardly revised 0.02 reading in January. The reading neared the index’s highest reading since December 2006 of 0.94. The less-volatile three month average of readings registered 0.37 last month, up sharply from the 0.16 reading in January. The Chicago Fed’s Index is a weighted average of 85 economic indicators designed so that zero represents trend growth, while a three-month average below -0.70 suggests a recession has begun.
Consumer confidence slipped in March, but remained near an 18-year high. The Conference Board stated U.S. consumer confidence dipped 2.3 points to 127.7 this month, missing economists’ forecast of 131.0. Following the volatility on Wall Street, Americans were a bit less optimistic about current business conditions and the stock market. They were still optimistic about job availability, though they weren’t sure it would still be the case six months from now. How Americans feel about their current situation, the so-called present situation index, dipped slightly to 159.9 from 161.2. Lynn Franco, director of economic indicators at the board stated, “Overall expectations remain quite favorable. Despite the modest retreat in confidence, index levels remain historically high and suggest further strong growth in the months ahead.”
Spending among the nation’s consumers increased 0.2% last month, according to the latest data from the Commerce Department. Spending on goods expected to last at least three years, so-called “durable goods”, rebounded 0.2%, as well, after tumbling 1.5% in January. Inflation moderated slightly according to the Federal Reserve’s preferred inflation gauge, the Personal Consumption Expenditures index. The PCE index, excluding food and energy, rose 0.2% last month following a 0.3% rise in January. Year over year, the core PCE price index rose 1.6%, its biggest gain since February of last year. Economists believe the annual core PCE price index could accelerate to 1.9% in March as last year’s weak readings drop out of the calculation. That would be just shy of the 2% “ideal” target of the Federal Reserve.
Consumer sentiment for the month of March hit its highest level since 2004 at 101.4, according to the University of Michigan’s survey of consumers. The index dipped slightly from its mid-month report due to uncertainty about the impact of proposed trade tariffs. Somewhat surprisingly, it was the nation’s low-income earners that boosted the reading to record-levels, while confidence among the nation’s highest earning workers declined. March’s gain was driven predominantly by lower-income households’ where the tight labor market is pulling workers off the sidelines and pushing up wages thereby increasing consumers’ optimism. Richard Curtin, chief economist of the survey noted, “All of the March gain in the Sentiment Index was among households with incomes in the bottom third… those in the middle third were unchanged, while the Index fell among households in the top third.”
The pace of growth in the U.S. economy in the final quarter of last year rose 0.4% to 2.9%, according to the latest revision of Gross Domestic Product (GDP). The Commerce Department attributed the gain to the biggest increase in consumer spending in three years and higher investment in business inventories. The increase followed expansions of 3.1% and 3.2% in the second and third quarters, respectively. In its latest GDP update, consumer spending was revised up to show a 4% increase, while business investment was raised to 6.3% from 2.5%. Other key figures in the GDP report remained essentially unchanged. The U.S. economy ended last year on a fairly high note; however, it may have gotten off to a weaker start in the new year. Most economists are predicting GDP growth of less than 2% for the first quarter of this year due to slower spending by consumers and businesses.
International Economic News: Canada’s economy shrunk unexpectedly in January, weighed down by sharp declines in oil production and tougher regulation in the real estate sector. Statistics Canada reported GDP contracted 0.1% in January, as the economy faces a broad slowdown after surging last year. Along with the decline in energy production and real estate, rising interest rates appear to be forcing highly indebted households to cut spending. Mark McCormick, North American head of FX strategy at Toronto-Dominion Bank noted, “The economy is slowing down as rate hikes are probably biting.” The Bank of Canada has raised borrowing costs three times since July. While economist had anticipated a relatively weak GDP report in light of a string of tepid earlier indicators for the month, they had expected the economy to have kept its head slightly above water. Their average estimate called for growth of 0.1%.
Britain’s economy expanded by more than previously thought according to official data out this week. The Office for National Statistics said in a revised estimate that gross domestic product stood at 1.8% last year, a tick more than previously believed. The reading was still a slowdown from the 1.9% expansion in 2016, and 2.3% in 2015. Last year was the lowest level of UK annual growth since 2012, as the uncertainty surrounding Brexit continues to hamper economic activity. Britain is scheduled to depart from the European Union on March 30, 2019. Analyst Dennis de Jong at trading site UFX noted, “With a year to go until Brexit there were no surprises with today’s GDP reading for the final quarter of 2017 and it is unlikely to have an impact on the pound, or the Bank of England’s view on raising interest rates in May.”
France’s ex-president Nicolas Sarkozy is to face trial for corruption and influence peddling, prosecutors say. The case revolves around an alleged attempt by Mr. Sarkozy to get a judge to reveal information about an investigation into illegal funding of his 2007 campaign. In 2014, two years after being voted out of office, the former French president reportedly contacted the senior magistrate of France’s highest court and offering to use his contacts to secure a prestigious role in Monaco in exchange for information on a financing case. The call was wiretapped by police. In other scandals, Mr. Sarkozy was accused of taking cash from L’Oreal heiress Liliane Bettencourt to help him win the 2007 election, and taking campaign funding from late Libyan dictator Muammar Gaddafi.
Germany’s jobless rate hit a fresh record low, reflecting the strength of Europe’s largest economy. The unemployment rate downticked in March to a seasonally-adjusted 5.3%, according to data from the country’s Federal Employment Agency. The number of jobless people fell below 2.5 million in March, which was 19,000 fewer than the month before and 204,000 less than the same time last year. Analysts said the figures were supported by strong domestic consumption and international economic performance. Germany has recorded robust economic expansion in recent months, causing some to raise concerns about an overheating economy. The country’s GDP is expected to grow at least 2.7% this year, which would be its strongest pace since 2011.
After days of threats from both sides, reports are circulating that the U.S. and China are quietly seeking to find solutions to their trade differences. China’s economic czar in Beijing, Liu He and U.S. Treasury Secretary Steven Mnuchin have been conducting talks behind the scenes covering wide areas of the two nations’ trade including financial services and manufacturing. The Trump administration had set out specific requests that included a reduction of Chinese tariffs on U.S. automobiles, more Chinese purchases of semiconductors, and greater access to China’s financial sector by American companies. Mr. Mnuchin called Liu He to congratulate him on the official announcement of his new role in the Chinese government. A Treasury spokesman also stated, “They also discussed the trade deficit between our two countries and committed to continuing the dialogue to find a mutually agreeable way to reduce it.”
Industrial production in Japan rebounded in February from a large decline the previous month and companies forecast further in gains in the coming months according to the Ministry of Economy, Trade, and Industry. The report indicates that factory output is back on the path toward expansion. Factory output rose 4.1% in February, missing economists’ forecast of 5%, but recovering from the 6.8% decline seen the previous month. The increase was led by a higher output of cars, construction equipment, and semiconductors. In a separate report, labor demand eased slightly while the jobless rate edged higher, but the labor market remained tight due to the continued shortage of workers. Japan’s economy has grown for eight straight quarters, its longest continuous expansion since the 1980s, moving Prime Minister Shinzo Abe’s revival plan a step closer to finally bringing to an end decades of stagnation.
Finally: President Trump’s most oft-repeated pledge is his promise to “Build that wall!” He has also promised that Mexico would pay for it, despite Mexican government officials scoffing at the notion. Some observers have proposed paying for it with a tax on remittances going back to Mexico from Mexican nationals living in the US (whether legally or illegally).
To get a grasp of the size of remittances going to Mexico (and other destinations), the Pew Research Center organized data from the World Bank and the result is shown in the graphic below (graphic created by howmuch.net). The numbers only reflect money being transferred via banks and wire transfer companies (like Western Union), and does not reflect money being sent through the mail or on the persons of border crossers, which the World Bank estimates could add on another 50%.
As can be seen, the sums being sent to Mexico are staggeringly large, and a tax on it could potentially raise, as President Trump might put it, a “yuuuuuuuuge” amount of money for his wall.

(sources: all index return data from Yahoo Finance; Reuters, Barron’s, Wall St Journal, Bloomberg.com, ft.com, guggenheimpartners.com, zerohedge.com, ritholtz.com, markit.com, financialpost.com, Eurostat, Statistics Canada, Yahoo! Finance, stocksandnews.com, marketwatch.com, wantchinatimes.com, BBC, 361capital.com, pensionpartners.com, cnbc.com, FactSet)
Indices mentioned are unmanaged and cannot be invested into directly. Past performance is no guarantee of future results. All Investing involves risk. Depending on the types of investments, there may be varying degrees of risk. Investors should be prepared to bear loss, including total loss of principal.