
4-8-19 Weekly Market Update
The very big picture:
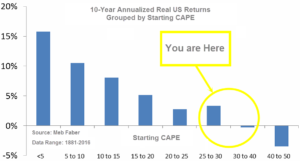
The long-term valuation of the market is commonly measured by the Cyclically Adjusted Price to Earnings ratio, or “CAPE”, which smooths out shorter-term earnings swings in order to get a longer-term assessment of market valuation. A CAPE level of 30 is considered to be the upper end of the normal range, and the level at which further PE-ratio expansion comes to a halt (meaning that increases in market prices only occur in a general response to earnings increases, instead of rising “just because”). The market is currently at that level.
Of course, a “mania” could come along and drive prices higher – much higher, even – and for some years to come. Manias occur when valuation no longer seems to matter, and caution is thrown completely to the wind as buyers rush in to buy first and ask questions later. Two manias in the last century – the 1920’s “Roaring Twenties” and the 1990’s “Tech Bubble” – show that the sky is the limit when common sense is overcome by a blind desire to buy. But, of course, the piper must be paid and the following decade or two are spent in Secular Bear Markets, giving most or all of the mania gains back.

See Fig. 1 for the 100-year view of Secular Bulls and Bears. The CAPE is now at 31.13, up from the prior week’s 30.50, above the level reached at the pre-crash high in October, 2007. Since 1881, the average annual return for all ten year periods that began with a CAPE around this level have been in the 0% – 3%/yr. range. (see Fig. 2).
In the big picture:
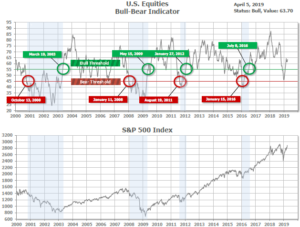
The “big picture” is the months-to-years timeframe – the timeframe in which Cyclical Bulls and Bears operate. The U.S. Bull-Bear Indicator (see Fig. 3) is in Cyclical Bull territory at 63.70, up from the prior week’s 62.03.
In the intermediate and Shorter-term picture:
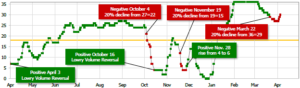
The Shorter-term (weeks to months) Indicator (see Fig. 4) turned negative on March 22nd. The indicator ended the week at 30, up from the prior week’s 27. Separately, the Intermediate-term Quarterly Trend Indicator – based on domestic and international stock trend status at the start of each quarter – was positive entering April, indicating positive prospects for equities in the second quarter of 2019.
Timeframe summary:
In the Secular (years to decades) timeframe (Figs. 1 & 2), the long-term valuation of the market is historically too high to sustain rip-roaring multi-year returns. The Bull-Bear Indicator (months to years) remains positive (Fig. 3), indicating a potential uptrend in the longer timeframe. In the intermediate timeframe, the Quarterly Trend Indicator (months to quarters) is positive for Q2, and the shorter (weeks to months) timeframe (Fig. 4) is negative. Therefore, with two indicators positive and one negative, the U.S. equity markets are rated as Neutral.
In the markets:
U.S. Markets: U.S. stocks recorded solid gains for the week and most major indexes are now back within 2% of their all-time highs, set last September. The S&P 500 index recorded seven consecutive days of gains, its longest winning streak since 2017. The Dow Jones Industrial Average added 496 points last week to close at 26,424, a gain of 1.9%. The technology-heavy NASDAQ Composite gained 2.7% and closed at 7,938. By market cap, the large cap S&P 500 rose 2.1%, while both the S&P 400 mid cap index and small cap Russell 2000 index added 2.8%.
International Markets: All major international markets finished in the green last week. Canada’s TSX rose 1.8% and the United Kingdom’s FTSE added 2.3%. On Europe’s mainland, France’s CAC 40 gained 2.4%, Germany’s DAX surged 4.2%, and Italy’s Milan FTSE rose 2.2%. In Asia, China’s Shanghai Composite jumped 5.0%, while Japan’s Nikkei added 2.8%. As grouped by Morgan Stanley Capital International, developed markets rose 2.1%, while emerging markets surged 3.5%.
Commodities: Precious metals were weak, reacting to strength in the stock markets. Gold retreated -0.2% to close at $1295.60 an ounce, and Silver also finished down -0.2% at $15.09 per ounce. Energy continued to be bid higher, now up five consecutive weeks. West Texas Intermediate crude oil surged 4.9%, closing at $63.09 per barrel. The industrial metal copper, viewed by analysts as a barometer of global economic health due to its variety of industrial uses, retreated -1.4% last week.
U.S. Economic News: The number of people applying for first-time unemployment benefits at the end of last month fell to their lowest level in almost 50 years—a very reassuring sign for the economy amid other reports which hinted at slower growth early in the year. The Labor Department reported initial jobless claims fell by 10,000 to 202,000. Economists had forecast a reading of 216,000. Jobless claims have fallen three weeks in a row and are down sharply from the beginning of the year. The downward descent is also apparent in the less-volatile monthly moving average of claims, which fell by 4,000 to 213,000. That number is at its lowest level since October. Continuing claims, which counts the number of people already receiving benefits, slipped by 38,000 to 1.72 million.
The U.S. economy added 196,000 jobs last month, handily beating economists’ forecasts for 179,000 new jobs and a positive sign of the health of the U.S. economy. Hiring increased in most major segments of the economy, especially among health care and white-collar employers. Health-care providers led the way with 49,000 new positions added, followed by professional and technical firms, which added 34,000. The unemployment rate held near its 50-year low of 3.8%, the Labor Department reported. Although a significant number of large companies have announced layoffs recently, most firms are still looking to hire. Employers continue to report a shortage of skilled labor. Addressing concerns that a strong labor market may lead to inflation and therefore Fed rate hikes, Eric Winograd, senior economist at AllianceBernstein wrote, “The labor market is certainly strong enough to keep the economy moving forward, but it isn’t generating the sort of inflationary pressure that would push the Fed off of its patient stance.”
Orders for “durable goods” (goods expected to last at least 3 years), slumped in February largely due to fewer orders for commercial aircraft and defense-related hardware. The Commerce Department reported durable-goods orders sank -1.6%, however the reading was better than the forecast of a -2.1% decline. It was its first negative reading in four months. Stripping out the volatile transportation component, orders actually rose 0.1%. Core capital-goods orders, a key measure of business investment, fell for the third time in four months—down ‑0.1%. Business investment has been flat for the last three months and up just 2.6% over the past year. That is down sharply from the 10% year-over-year pace seen a year and a half ago.
Sales at the nation’s retailers fell in February for the second time in the last three months, according to the Commerce Department. The weaker sales number was another sign of the slowdown affecting broad areas of the U.S. economy. Retail sales declined -0.2% in February, far lower than the 0.3% increase economists had expected. However, offsetting the decline was a bigger gain in January than was initially reported. The government revised sales upward in the first month of the year to show a 0.7% increase instead of 0.2%. While most retail segments showed no or little growth, sales at gas stations rose 1% and auto dealers posted a 0.7% increase. Chief Economist Richard Moody of Regions Financial stated, “Our bottom line is that U.S. consumers remain on firm footing, though rising gasoline prices could curb growth in spending in other categories.”
The Institute for Supply Management (ISM) reported its index of manufacturing activity rebounded last month, after hitting a 2-year low in February. ISM’s manufacturing index rose to 55.3 from 54.2, exceeding analyst forecasts of 54.6. In the details, the sub-index for new orders jumped 1.9 points to 57.4, while the production sub-index rose 1 point to 55.8 and the employment sub-index surged 5.2 points to 57.5. By industry, sixteen of the eighteen manufacturing industries surveyed by ISM expanded in March. The report provides evidence that, at least in manufacturing, the economy continues to grow. Richard Moody, Chief Economist at ISM summed up the report writing, “There is nothing in the details of the data or the comments to make you think the expansion is going to come to an end anytime soon.”
In the services sector, ISM reported growth at its slowest pace in over a year and a half, but firms remain “optimistic”. ISM’s non-manufacturing (services) index retreated 3.6 points to 56.1 last month, but that was down from one of the highest readings in decades. Analysts consider readings over 50 as positive for the economy, and anything over 55 is exceptional. In the report, new orders and production retreated from very high levels, but still showed plenty of strength. Sixteen of the eighteen services industries tracked by ISM showed expansion, while only two—education and retail—contracted. Jim O’Sullivan, chief U.S. economist at High Frequency Economics observed, “The data are consistent with moderate rather than dramatic slowing in the economy.”
International Economic News: The heads of Canada’s two largest banks delivered a similar sounding message this week—the country’s economy could be doing better. Bharat Masrani, Toronto-Dominion Bank president and chief executive officer told shareholders that his company’s economics unit expects “constrained growth” for Canada this year, noting that there were economic “problems” that still need fixing. “Like how to export our oil and natural gas to global markets, reduce trade barriers between provinces, eliminate red tape, increase the supply of Canadian housing and accelerate much-needed infrastructure projects, just to name a few,” Masrani said. Similarly, Royal Bank of Canada CEO Dave McKay told his shareholders that the country has lost “momentum”. “Our competitiveness is challenged,” McKay said. “Our capacity to grow and advance our economy is stalling.” Steps that Canada can take to improve its competitiveness include building digital and physical infrastructure, such as energy pipelines, McKay said.
Ratings agency Standard and Poors reported the United Kingdom has lost more than 6.6 billion pounds ($8.7 billion) in economic activity every quarter since it voted to leave the European Union. In its latest report, the agency’s senior economist Boris Glass said the world’s fifth-biggest economy would have been 3% larger by the end of last year if the country had not voted in a June 2016 referendum to leave the EU. Quarterly growth rates would have averaged about 0.7%, rather than 0.43%, he said. “Immediately after the referendum, the pound fell by about 18 per cent. This was the single most pertinent indicator of the impact of the vote and the drag it created, via inflation, has been spreading through the economy.”
The “Gilets Jaunes” or “yellow jacket” protests continue to weigh on the French economy, according to research firm IHS Markit. According to a closely watched survey, France’s services sector fell back into contraction last month, as a series of anti-government protests continued to disrupt the economy. The IHS Markit Purchasing Managers’ Index (PMI), which gathers data by polling corporate executives, fell to 49.1 in March, down from 50.2 in February and below the 50 mark which separates expansion from contraction. The reading was slightly better than the forecast of 48.7. Companies reported the sharpest decline in export sales for three years, while there was also accelerated contraction in new business. Respondents blamed a reduction in new work predominantly on the “Gilets Jaunes” movement.
A group of leading German economic research institutes slashed their growth forecasts for Germany, and further warned that if Britain leaves the European Union without a deal, it could get even worse. In a joint statement, five leading research institutes – DIW, ifo, IfW, IWH, and RWI – said they were reducing their autumn forecast of 1.9% growth for Europe’s largest economy downward by half, to 0.8%, after concluding “political risks have further clouded the global economic environment.” The new assessment is in line with that issued last month by the German government’s panel of independent economic advisers, which lowered than the government’s own prediction to 1%
President Trump stopped just short of announcing a final trade deal with China this week, saying in an Oval Office meeting with a Chinese delegation that it may take four weeks or more to secure an “epic” trade agreement. Negotiators had originally intended to secure a deal this week during a visit from Chinese Vice Premier and special trade envoy Liu He, but after more than a year of tariffs, negotiations, and threats, the U.S. and China continue to haggle over some remaining issues. Referring to issues that remain unresolved, Mr. Trump mentioned intellectual property protection and theft. In remarks at the White House, Mr. Trump said that the deal was “very complete” and that the two sides had “agreed to far more than we have left to agree to.”
Household spending in Japan rose less than expected in February and real wages tumbled at the fastest pace in more than three years, raising concerns about the resiliency of Japanese consumers in an era of heightened global uncertainties. Household spending rose at a 1.7% annual rate, which was less than the median forecast of 2.1%. Taken with separate wages data, the numbers suggested household income may not be strong enough to underpin consumption at a time when exports and output are weakening. The data also suggest the government could come under pressure to delay a planned sales tax hike and turn to the Bank of Japan (BOJ) for help in supporting the economy. Norio Miyagawa, senior economist at Mizuho Securities, wrote in a note to clients, “The BOJ is on hold for now, but it may have to come up with something if there is another downside shock to the economy.”
Finally: A common mainstream-media portrayal of “anti-vaxxers”, or parents who opt out of getting their children vaccinated, is that they are backward anti-government conspiracy theorists who reside predominantly in rural enclaves in “fly-over” areas of the country. However, recent data from health insurance giant Blue Cross Blue Shield suggests otherwise. Their data, from a 2018 study, shows that the highest percent of parents who have refused to have their children vaccinated in the entire country were found in and around…New York City! The Eastern Long Island communities comprising Nassau County, New York – home of some of the wealthiest and most sophisticated neighborhoods in the state and country – topped the list, and two other New York metro area entities, including New York City itself, round out the top three.

(sources: all index return data from Yahoo Finance; Reuters, Barron’s, Wall St Journal, Bloomberg.com, ft.com, guggenheimpartners.com, zerohedge.com, ritholtz.com, markit.com, financialpost.com, Eurostat, Statistics Canada, Yahoo! Finance, stocksandnews.com, marketwatch.com, wantchinatimes.com, BBC, 361capital.com, pensionpartners.com, cnbc.com, FactSet) These are the opinions of WE Sherman and Co and not necessarily those of Cambridge, are for informational purposes only, and should not be construed or acted upon as individualized investment advice.
Securities offered through Registered Representatives of Cambridge Investment Research Inc., a broker-dealer, member FINRA/SIPC. Advisory Services offered through Cambridge Investment Research Advisors, a Registered Investment Adviser. Strategic Investment Partners and Cambridge are not affiliated.
Indices mentioned are unmanaged and cannot be invested into directly. Past performance is no guarantee of future results. All Investing involves risk. Depending on the types of investments, there may be varying degrees of risk. Investors should be prepared to bear loss, including total loss of principal.