
4-1-19 Weekly Market Update
The very big picture:
The long-term valuation of the market is commonly measured by the Cyclically Adjusted Price to Earnings ratio, or “CAPE”, which smooths out shorter-term earnings swings in order to get a longer-term assessment of market valuation. A CAPE level of 30 is considered to be the upper end of the normal range, and the level at which further PE-ratio expansion comes to a halt (meaning that increases in market prices only occur in a general response to earnings increases, instead of rising “just because”). The market is currently at that level.
Of course, a “mania” could come along and drive prices higher – much higher, even – and for some years to come. Manias occur when valuation no longer seems to matter, and caution is thrown completely to the wind as buyers rush in to buy first and ask questions later. Two manias in the last century – the 1920’s “Roaring Twenties” and the 1990’s “Tech Bubble” – show that the sky is the limit when common sense is overcome by a blind desire to buy. But, of course, the piper must be paid and the following decade or two are spent in Secular Bear Markets, giving most or all of the mania gains back.

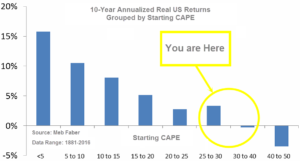
See Fig. 1 for the 100-year view of Secular Bulls and Bears. The CAPE is now at 30.50, up from the prior week’s 30.14, above the level reached at the pre-crash high in October, 2007. Since 1881, the average annual return for all ten year periods that began with a CAPE around this level have been in the 0% – 3%/yr. range. (see Fig. 2).
In the big picture:
The “big picture” is the months-to-years timeframe – the timeframe in which Cyclical Bulls and Bears operate. The U.S. Bull-Bear Indicator (see Fig. 3) is in Cyclical Bull territory at 62.03, up from the prior week’s 61.42.

In the intermediate and Shorter-term picture:
The Shorter-term (weeks to months) Indicator (see Fig. 4) turned negative on March 22nd. The indicator ended the week at 27, down from the prior week’s 29. Separately, the Intermediate-term Quarterly Trend Indicator – based on domestic and international stock trend status at the start of each quarter – was positive entering April, indicating positive prospects for equities in the second quarter of 2019.

Timeframe summary:
In the Secular (years to decades) timeframe (Figs. 1 & 2), the long-term valuation of the market is historically too high to sustain rip-roaring multi-year returns. The Bull-Bear Indicator (months to years) remains positive (Fig. 3), indicating a potential uptrend in the longer timeframe. In the intermediate timeframe, the Quarterly Trend Indicator (months to quarters) is positive for Q2, and the shorter (weeks to months) timeframe (Fig. 4) is negative. Therefore, with two indicators positive and one negative, the U.S. equity markets are rated as Neutral.
In the markets:
U.S. Markets: The major U.S. indexes managed to retrace most of the previous week’s losses and made the first quarter of 2019 the best quarter for stocks in a decade. The Dow Jones Industrial Average rose 426 points, finishing the week at 25,928 and posting a gain of 1.7%. The technology-heavy NASDAQ Composite added 87 points, or 1.1%, closing at 7,729. By market cap, the large cap S&P 500 rose 1.2%, while the mid cap S&P 400 gained 2.2% and the small cap Russell 2000 added 2.3%.
International Markets: Canada’s TSX rose a meager 0.1%, while the United Kingdom’s FTSE added 1.0%. Major markets in Europe rebounded from last week’s selling with France’s CAC 40 rising 1.5%, Germany’s DAX gaining 1.4%, and Italy’s Milan FTSE adding 1.0%. In Asia, China’s Shanghai Composite retreated -0.4% and Japan’s Nikkei fell -2.0%. As grouped by Morgan Stanley Capital International, developed markets rose 0.9%, while emerging markets added 1.2%.
Commodities: Gold retreated -1.1% to $1298.50 an ounce and Silver declined -1.9% to $15.11. Crude oil rose for a fourth consecutive week, up 1.9% closing at $60.14 per barrel. Copper retraced all of last week’s decline by rising 3.3%.
March Summary: For the month of March, the Dow rose a scant 0.05%, while the NASDAQ gained 2.6%, and the S&P 500 rose 1.8%. The mid cap S&P 400 and small cap Russell 2000 went the other way, declining -0.7% and ‑2.3%, respectively. In international markets, Canada’s TSX gained 0.6% and the UK’s FTSE rose 2.9%. France’s CAC 40 gained 2.1%, Germany’s DAX added 0.1%, and Italy’s Milan FTSE gained 3%. China’s Shanghai Composite surged 5.1% but Japan’s Nikkei fell -0.8%. Developed markets as a group gained 0.9% and emerging markets as a group added 1.1%. Precious metals retreated in March in the face of strength in the financial markets. Gold pulled back -1.3% and Silver declined -3.3%. The industrial metal copper declined -0.4%. West Texas Intermediate crude oil rose smartly by 5.1%.
First Quarter Summary: In the first quarter of 2019, the Dow gained 11%, the NASDAQ rose 17%, the S&P 500 gained 13%, and the S&P 400 and Russell 2000 each finished up 14%, capping off the best quarter in nearly a decade. International markets did nearly as well. Canada’s TSX rebounded 12.4% and the UK’s FTSE gained 8.2%. France’s CAC 40 rose 13.1%, Germany’s DAX added 9.2%, and Italy’s Milan FTSE gained 16.2%. China’s Shanghai Composite got the blue ribbon among equity markets by rising 24% and Japan’s Nikkei gained 6%. Developed markets as a group added 10.3% while emerging markets as a group rose 9.9%. Gold rose a modest 1.3% and Silver actually declined -2.8%. Copper finished ahead by 11.6% for the quarter and Oil was the big winner among the major commodities, surging 32.4%
U.S. Economic News: The number of Americans applying for new unemployment benefits fell by 5,000 last week to 211,000 matching the lowest level of the year. The reading was well below the consensus forecast of 220,000. The monthly average of new claims, smoothed to iron out the weekly volatility, fell by 3,250 to 217,250. The reading remains well below the 300,000 threshold analysts use to indicate a “healthy” labor market. Continuing claims, which counts the number of people already receiving benefits, rose by 13,000 to 1.76 million.
After a strong start to the year, the number of homes in which a contract has been signed but not yet closed fell 1% in February, the National Association of Realtors (NAR) reported. In addition, contract signings have declined on a year-over-year basis for 14 consecutive months. By region, there was a 7.2% drop in the Midwest, but the other regions saw smaller moves, including gains in the West and the South and a modest 0.8% drop in the Northeast. Lawrence Yun, the chief economist of the NAR, said the decline wasn’t a surprise after a strong January increase of nearly 5%. For the year, the NAR is forecasting existing home sales to fall 0.7% to 5.3 million and the median existing home price to climb just 2.7%.
The number of new homes under construction plunged 8.7% in March to an annual pace of 1.16 million, the Commerce Department reported. The reading was far below economists’ forecasts of just a 1.6% pullback. The decline was led by a 17% drop in single-family starts, the biggest drop since early 2015. Work on new construction plunged 30% in the Northeast, 19% in the West and 7% in the South. The Midwest was the lone bright spot, with starts rising 27%. Building permits also fell, down 1.6% to a 1.296-million-unit annual rate, but at least that reading exceeded forecasts of a 2.6% drop. From the same time last year, both housing starts and permits continued to decline, down 9.9% and 2.0%, respectively, year-over-year.
A measure of the broader U.S. economy showed slower growth for the beginning of 2019. The Chicago Fed’s National Activity Index (CFNAI) fell -0.04 points in February to -0.29 and has been in negative territory for four out of the last five months. In addition, the index is over 1 point below its level from the same time last year, making this drop the biggest year-over-year drop since February of 2015. The decline was led by employment-related indicators – payrolls growth, in particular, slowed markedly last month. The three-month average of the CFNAI dropped to -0.18, the lowest reading since October of 2016. The CFNAI is a weighted average of 85 economic indicators, designed so that zero represents trend growth. Of the 85 indicators, 38 made positive contributions in February, while 47 made negative contributions.
Confidence among the nation’s consumers fell in March, reflecting greater worries about the health of the U.S. economy. The Conference Board reported its Consumer Confidence Index dropped to 124.1 from 131.4 in February. Economists had expected a reading of 133. In the details, the “present situation index” fell 12 points to 160.6, its biggest one-month decline since the middle of the financial crisis in 2008. In addition, the measure of how Americans think the economy will be six months from now declined four points to 99.8. Confidence declined across all demographic and most income groups. Even so, the current level of confidence is nonetheless consistent with above-trend economic growth, and consumer spending remains the driving force of this expansion.
New Gross Domestic Product (GDP) figures show the economy grew a slower 2.2% in the fourth quarter, down from the 2.6% originally reported. The main contributors to the downgrade were downward revisions to consumer spending, government spending, and capital expenditures. In addition, adjusted pretax corporate profits fell slightly in the fourth quarter, marking the first decline in almost two years. Even after the downward revision, however, GDP for all of 2018 was left at 2.9%. That matched 2015 for the best performance since the Great Recession a decade ago. While some analysts are forecasting an impending recession, Sal Guatieri, senior economist of BMO Capital Markets stated, “The impact of tax cuts is fading, but the underlying trend in activity still points more to a moderation in growth rather than a recession.”
International Economic News: Canada’s economy began 2019 with its largest output gain in eight months, Statistics Canada reported. Gross Domestic Product grew by 0.3% in January, outpacing the 0.1% consensus forecast. The gains were broad-based outside of the energy sector, and included the biggest one-month increase in construction activity in more than five years. Manufacturing output also surged. The gains are expected to bolster confidence among officials at the Bank of Canada that growth will bounce back. Avery Shenfeld, chief economist at CIBC Capital Markets wrote in a note, “Overall, a better than expected start to Q1 after a near zero growth rate in Q4, and reason enough for the Bank of Canada to hang on to its hopes that the growth stall late last year will prove temporary.” Statistics Canada saw 18 of 20 industrial sectors posting increases in January. GDP grew by 1.6% in January from a year earlier, the agency said.
Across the Atlantic, lawmakers rejected UK Prime Minister Theresa May’s “Brexit” deal for a third time, sounding its probable death knell and leaving Britain’s withdrawal from the European Union in turmoil on the very day it was scheduled to leave the bloc. The decision to reject a pared-down version of May’s deal makes it now totally unclear how, when, or even whether Britain will leave the EU. After a special sitting of parliament, lawmakers voted 344-286 against May’s 585-page EU Withdrawal Agreement, agreed after two years of tortuous negotiations with the bloc. May had told parliament the vote was the last opportunity to ensure Brexit would take place and cautioned that if the deal failed, then any further delay to Brexit would probably be a long one beyond April 12.
Despite months of violent anti-government “yellow vest” protests, the French economy managed to maintain a steady pace of growth. French statistics agency INSEE reported the Eurozone’s second-biggest economy grew 0.3% in the final quarter of last year, and grew 1.6% over the course of 2018, a tick better than the 1.5% estimate. Strong exports from companies such as Airbus helped to offset weaker consumer spending. Consumer spending was flat after growing 0.4% in the previous quarter. In the corporate sector, investment growth fell to 0.3% from 1.7% in the third quarter as companies’ profit margins nudged up to 31.8% from 31.7% in the third quarter, INSEE said.
The German unemployment rate hit a fresh record low in March as demand for labor remained strong. Detlef Scheele, head of the Federal Employment Agency said, “The jobs market continues to develop favorably, despite receding economic tailwinds.” Germany’s seasonally-adjusted jobless rate fell to 4.9% this month from 5.0% in February. The reading marks the lowest rate since the beginning of the data in January 1992. Jobless claims dropped by 7,000 from the month before, the agency said, although economists had forecast a decline of 10,000.
In Asia, the latest report by research firm China Beige Book found “an unmistakable first-quarter recovery” driven by an increase in credit, which seems to run counter to Beijing’s supposed efforts to reduce reliance on debt. The report stated revenue, profits, investment, and hiring all improved nationwide compared with both the previous quarter and the year-ago period. The China Beige Book found that the rate of borrowing by private companies in the first quarter was greater than that of state-owned enterprises. The survey also found that reports of corporate borrowing reached the highest point since the middle of 2013. The survey said the proportion of loans made through the murky world of shadow banking increased for a second-straight quarter to the highest level since the second quarter of 2016, a worrisome development.
Japan’s factory output expanded for the first time in four months in February, though the rebound and overall outlook remain weak. Data from the Ministry of Economy, Trade and Industry showed factory output rose 1.4%, led by production of cars and semiconductor production equipment. The reading exceeded forecasts of a 1.0% increase. Manufacturers surveyed by the ministry expect production to rise 1.3% in March and 1.1% in April. However, even if the forecasts materialize, the first quarter production would undershoot the previous three months, officials said, stating the rebound would not be “strong enough”. Marcel Thieliant, senior Japan economist at Capital Economics predicted the economy would contract 0.4% in the first quarter and stagnate over the remainder of the year.
Finally: It seems that almost all financial planning websites have essentially the same advice for saving money—cut out the $5 lattes, eating out, spending on entertainment, and a myriad of other non-essential activities that almost everyone enjoys. However, when brokerage firm TD Ameritrade surveyed its clients who it deemed “Super Savers” for saving 20% or more of their incomes, they found something radically different. It turns out the single biggest difference between the spending of Super Savers and the rest of us…was spending on housing. Super Savers spend just 14% of their incomes on housing, while everyone else averaged about 23%. They managed this mostly by simply living in smaller houses – a radical idea in the “bigger is better” real estate world. A recent American Enterprise Institute report showed how dramatically the size of the average house has grown at the very same time that the size of the family living in that average house has dramatically shrunk.

(sources: all index return data from Yahoo Finance; Reuters, Barron’s, Wall St Journal, Bloomberg.com, ft.com, guggenheimpartners.com, zerohedge.com, ritholtz.com, markit.com, financialpost.com, Eurostat, Statistics Canada, Yahoo! Finance, stocksandnews.com, marketwatch.com, wantchinatimes.com, BBC, 361capital.com, pensionpartners.com, cnbc.com, FactSet) These are the opinions of WE Sherman and Co and not necessarily those of Cambridge, are for informational purposes only, and should not be construed or acted upon as individualized investment advice.
Securities offered through Registered Representatives of Cambridge Investment Research Inc., a broker-dealer, member FINRA/SIPC. Advisory Services offered through Cambridge Investment Research Advisors, a Registered Investment Adviser. Strategic Investment Partners and Cambridge are not affiliated.
Indices mentioned are unmanaged and cannot be invested into directly. Past performance is no guarantee of future results. All Investing involves risk. Depending on the types of investments, there may be varying degrees of risk. Investors should be prepared to bear loss, including total loss of principal.