
4-22-19 Weekly Market Update
The very big picture:
The long-term valuation of the market is commonly measured by the Cyclically Adjusted Price to Earnings ratio, or “CAPE”, which smooths out shorter-term earnings swings in order to get a longer-term assessment of market valuation. A CAPE level of 30 is considered to be the upper end of the normal range, and the level at which further PE-ratio expansion comes to a halt (meaning that increases in market prices only occur in a general response to earnings increases, instead of rising “just because”). The market is currently at that level.
Of course, a “mania” could come along and drive prices higher – much higher, even – and for some years to come. Manias occur when valuation no longer seems to matter, and caution is thrown completely to the wind as buyers rush in to buy first and ask questions later. Two manias in the last century – the 1920’s “Roaring Twenties” and the 1990’s “Tech Bubble” – show that the sky is the limit when common sense is overcome by a blind desire to buy. But, of course, the piper must be paid and the following decade or two are spent in Secular Bear Markets, giving most or all of the mania gains back.

See Fig. 1 for the 100-year view of Secular Bulls and Bears. The CAPE is now at 30.62, down from the prior week’s 31.28, above the level reached at the pre-crash high in October, 2007. Since 1881, the average annual return for all ten year periods that began with a CAPE around this level have been in the 0% – 3%/yr. range. (see Fig. 2).

In the big picture:
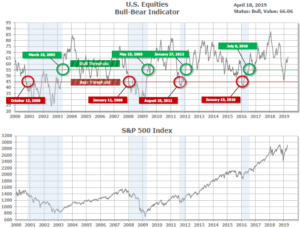
The “big picture” is the months-to-years timeframe – the timeframe in which Cyclical Bulls and Bears operate. The U.S. Bull-Bear Indicator (see Fig. 3) is in Cyclical Bull territory at 66.06, up from the prior week’s 65.47.
In the intermediate and Shorter-term picture:
The Shorter-term (weeks to months) Indicator (see Fig. 4) turned negative on March 22nd. The indicator ended the week at 34, up from the prior week’s 33. Separately, the Intermediate-term Quarterly Trend Indicator – based on domestic and international stock trend status at the start of each quarter – was positive entering April, indicating positive prospects for equities in the second quarter of 2019.

Timeframe summary:
In the Secular (years to decades) timeframe (Figs. 1 & 2), the long-term valuation of the market is historically too high to sustain rip-roaring multi-year returns. The Bull-Bear Indicator (months to years) remains positive (Fig. 3), indicating a potential uptrend in the longer timeframe. In the intermediate timeframe, the Quarterly Trend Indicator (months to quarters) is positive for Q2, and the shorter (weeks to months) timeframe (Fig. 4) is negative. Therefore, with two indicators positive and one negative, the U.S. equity markets are rated as Neutral.
In the markets:
U.S. Markets: The major indexes finished the week mixed with smaller-cap indexes lagging the rest. The Dow Jones Industrial Average rose 147 points to close at 26,559, a gain of 0.6%. The NASDAQ Composite had its fourth week of gains adding a modest 0.2%. The large cap S&P 500 retreated a small -0.1%, while the mid cap S&P 400 gave up -0.6% and the small cap Russell 2000 declined -1.2%.
International Markets: Almost all major international markets finished the week in the green. Canada’s TSX had its fourth week of gains, adding 0.8%. In Europe, the United Kingdom’s FTSE rose 0.3%, and on Europe’s mainland France’s CAC 40 added 1.4% and Germany’s DAX surged 1.9%. In Asia, China’s Shanghai Composite added 0.8% and Japan’s Nikkei gained 1%. As grouped by Morgan Stanley Capital International developed markets rose 0.4%, while emerging markets added 0.5%.
Commodities: Precious metals continued to fall as Gold retreated almost $20 an ounce to $1276.00, a decline of -1.5%. Silver was essentially flat falling just a penny to $14.95 an ounce. Energy, on the other hand, continued its rally – now up seven weeks in a row. West Texas Intermediate crude oil added 0.3% finishing the week at $64.07 per barrel. The industrial metal copper, seen by some analysts as a barometer of world economic health due to its wide variety of uses, retraced the majority of last week’s gain and finished the week down -0.9%.
U.S. Economic News: The number of workers seeking new unemployment benefits fell to its lowest level since the height of the Vietnam War. The Labor Department reported initial jobless claims last week fell by 5,000 to 192,000—the fifth down week in a row. Economists had forecast a reading of 204,000. New claims have totaled less than 200,000 for the second consecutive week, an event that hasn’t occurred since Richard Nixon was president. Reduced layoffs, consistent hiring, and the lowest unemployment rate in 50 years have produced a strong labor market that continues to fuel an economic expansion that is now almost a decade old.
Sentiment among the nation’s homebuilders hit a 6 month high this month as the housing market continues to rebound. The National Association of Home Builders’ reported its monthly confidence index rose 1 point to 63 this month. The reading matched economists’ forecasts. In the report, the gauge of current sales conditions rose one point to 69, while the index that tracks expectations for the next 6 months fell a point to 71. The sub-index that measures traffic of prospective buyers jumped three points to 47. Many analysts remain optimistic about the housing market as mortgage rates remain low and concerns surrounding changes in the tax law in 2017 continue to recede.
Sales at the nation’s retailers surged last month – the latest report that the economy is firming up after weakness at the beginning of the year. The Commerce Department reported retail sales soared 1.6% in March, greatly exceeding forecasts of a gain of 1.1%. Sales of new cars and trucks rose 3.1%, the best performance of this year and giving the broader retail industry a boost. Vehicle sales represent about 20% of all retail sales. Less beneficially, consumers also spent more to fill up their gas tanks as the average price of gas rose almost 10% last month. Ex-auto and gas, retail sales still rose 0.9%. Among the winners were internet retailers, clothing stores, home-furnishing outlets, and grocers. Jim Baird, chief investment officer at Plante Moran Financial Advisors stated, “The bottom line is this: fears about the softening in the economy late last year were overblown. Taken in its totality, a broad swathe of data still paints a largely positive picture.”
The Federal Reserve’s Beige Book, a summary of anecdotes and commentaries on current economic conditions from each of its member banks, reported economic activity expanded at a “slight-to-moderate” pace last month and the beginning of this month. A “few” districts reported strengthening in activity. Overall, reports from the Fed’s respondents suggested sales were sluggish for both general retailers and auto dealers. However, home sales and tourism were bright spots. Agricultural conditions were weak as several Midwest districts reported widespread flooding. In addition, all reported the labor market remained tight, although the ability of firms to pass increased input costs to consumers was “mixed”. Overall, while not as downbeat as the prior report, the Beige Book did not characterize an economy firing on all cylinders.
Factory production in the New York region picked up somewhat this month, but nonetheless remained “fairly subdued” said the New York Federal Reserve this week. The New York Fed’s Empire State business conditions index rebounded to a reading of 10.1 from the nearly two-year low of 3.7 set in March, matching economists’ expectations. In the details, the new-orders index rose 4.5 points to 7.5 and shipments ticked up 0.9 points to 8.6. Of concern, however, the index for future business conditions dropped 17 points to 12.4—its lowest level in more than three years. Robert Brusca, chief economist at FAO Economics stated the future activity index “has been only weaker five times since January 2005 and four of those were in a recession.
A similar report from the Philadelphia Fed showed manufacturing in that region slowed significantly, declining from a reading of 13.7 in March to 8.5. Economists had expected a reading of 11. In the report, the new orders index climbed 14 points to 15.7, current shipments fell 2 points, while delivery times fell into negative territory for the first time in two and a half years. Similar to the New York Fed’s report, the index for the outlook for future activity fell to its lowest reading since February 2016. Manufacturing has struggled of late, with the Federal Reserve reporting that industrial production in the first quarter was the weakest since the third quarter of 2017. Joshua Shapiro, chief U.S. economist at MFR stated, “The fact that the new-order measure recovered nicely after two very weak months is an encouraging sign and suggests that the factory sector, while suffering from weak demand abroad and the effects of tariffs, is not sinking into a slump.”
International Economic News: Canada’s economy is expected to grow at a “sustainable pace” according to the latest report from independent audit and tax consulting firm RSM Canada. In its inaugural report, RSM Canada stated that after two years of steady economic growth Canadians can anticipate a modestly slower rate of growth. Furthermore, RSM anticipates the primary drivers of growth this year will be modest consumer spending, government expenditures, and an economy bolstered by business investment. The RSM Canada report predicts a modestly slower rate of growth near 1.8%, down from 2% in 2018. The report also noted the impact from the 2014 to 2016 collapse in oil prices is still affecting the economy. Since 2015, the falloff in crude oil prices has reduced the rate of overall growth in the Canadian economy by 1%.
A newly-unveiled “early warning system” that uses so-called “big data” to track the health of the United Kingdom’s economy revealed a loss of momentum in the first quarter of the year. The UK’s Office for National Statistics published an index this week based on VAT (value added tax) returns for the first time. A majority of companies in the UK recorded a decline in turnover in the first quarter, signaling a “very slight” decrease in the measure. The results are among the first readings of the statistics agency’s experiment with “big data” to try to follow the course of the economy in near real-time and alert policymakers to looming booms and busts. ONS lead data scientist Louisa Nolan said the information gives “much quicker signals of changes in the UK economy than was possible before”.
On Europe’s mainland, France’s economy got off to a good start in the second quarter with business activity stabilizing as the economic disruption from the so-called “yellow-vest” protests diminished in March. Research firm IHS Markit stated its Purchasing Managers’ Index, which measures private-sector activity, rose 1.1 points to 50 in March, exceeding economist expectations. Eliot Kerr, an economist at IHS Markit stated, “The stabilization of output in April is further evidence of the dwindling economic impact of the ‘gilets jaunes’ demonstrations.” However of concern, new orders fell for a fifth consecutive month indicating an underlying slowing in demand is evident. Policymakers at the European Central Bank were hoping for more clear direction from the report before their next meeting in June, when they may need to decide if more monetary support is needed.
The German economy is headed for its worst growth in six years, according to the German government. Slowing global momentum, concerns over Brexit, and trade disputes prompted the economy ministry to cut its estimate for growth to just 0.5% – just half its previous forecast. The figure is the latest in a series of downwardly revised projections from a high of 2.1% growth last year. The ministry maintains a growth rate of 1.5% for 2020. While there’s been a small improvement in business confidence, manufacturing in Germany remains in a deep slump. Based on European Commission forecasts for the rest of the euro area, the government’s latest prediction would leave Germany as the region’s second worst performer, narrowly outpacing Italy.
China’s economy expanded at 6.4% in the first quarter from a year earlier, exceeding economists’ forecasts of a 6.3% increase. Beijing has been actively pursuing efforts to boost its slowing economy including tax cuts, while trying not to increase debt. The results followed a sharp pick-up in factory output, with industrial production surging 8.5% last month. Other data also showed improvement. Retail sales for March rose 8.7% from the same time last year, and fixed asset investment expanded 6.3%. Capital Economics China economist Julian Evans-Pritchard noted, “There is no denying that China’s economy ended the first quarter on a stronger note.”
The Japanese government left its assessment of the economy unchanged in April, after a rare downgrade in March, saying the U.S.-China trade war remained a threat to exports and economic growth. The Cabinet Office, which helps coordinate government policy, last month blamed the trade dispute for the first downgrade of its overall assessment in three years. In its latest review, the office said the economy remained in a gradual recovery, but exports and output showed signs of weakness. The risks to Japan’s economic outlook could spur calls for the government to delay a nationwide sales tax hike from 2% all the way to 10% scheduled for October. Some economists are concerned the planned tax hike will weaken consumer spending and harm growth.
Finally: Florida is generally considered the nation’s top destination for retirees. But in a survey by United Van Lines late last year it was revealed that, according to its data, New Mexico was actually the nation’s top retirement destination. The relocation company polled 26,998 of its customers who moved last year and found that among those who moved to New Mexico, 42% did so because of retirement, while Florida came in second with 38% of people citing retirement. Arizona rounded out the top three. Low taxes and good weather were cited as the primary reasons. Meanwhile, the number 1 state losing people in their golden years was New Jersey, which has the highest effective property tax rate in the country at 2.13%, and a top individual income tax rate of almost 11%. “Voting with their feet” is a phrase that comes to mind. The infographic below, from CNBC, shows the income tax burden for every state, ranging from $0 to more than $2,000 per capita. No surprise that the states receiving retirees are in the low tier of taxes, and those losing the most are in the top tier.

(sources: all index return data from Yahoo Finance; Reuters, Barron’s, Wall St Journal, Bloomberg.com, ft.com, guggenheimpartners.com, zerohedge.com, ritholtz.com, markit.com, financialpost.com, Eurostat, Statistics Canada, Yahoo! Finance, stocksandnews.com, marketwatch.com, wantchinatimes.com, BBC, 361capital.com, pensionpartners.com, cnbc.com, FactSet) These are the opinions of WE Sherman and Co and not necessarily those of Cambridge, are for informational purposes only, and should not be construed or acted upon as individualized investment advice.
Securities offered through Registered Representatives of Cambridge Investment Research Inc., a broker-dealer, member FINRA/SIPC. Advisory Services offered through Cambridge Investment Research Advisors, a Registered Investment Adviser. Strategic Investment Partners and Cambridge are not affiliated.
Indices mentioned are unmanaged and cannot be invested into directly. Past performance is no guarantee of future results. All Investing involves risk. Depending on the types of investments, there may be varying degrees of risk. Investors should be prepared to bear loss, including total loss of principal.