
4-6-20 Weekly Market Update
The very Big Picture
The long-term valuation of the market is commonly measured by the Cyclically Adjusted Price to Earnings ratio, or “CAPE”, which smooths-out shorter-term earnings swings in order to get a longer-term assessment of market valuation. A CAPE level of 30 is considered to be the upper end of the normal range, and the level at which further PE-ratio expansion comes to a halt (meaning that further increases in market prices only occur as a general response to earnings increases, instead of rising “just because”). The market was recently at that level.
Of course, a “mania” could come along and drive prices higher – much higher, even – and for some years to come. Manias occur when valuation no longer seems to matter, and caution is thrown completely to the wind – as buyers rush in to buy first, and ask questions later. Two manias in the last century – the “Roaring Twenties” of the 1920s, and the “Tech Bubble” of the late 1990s – show that the sky is the limit when common sense is overcome by a blind desire to buy. But, of course, the piper must be paid, and the following decade or two were spent in Secular Bear Markets, giving most or all of the mania-gains back.
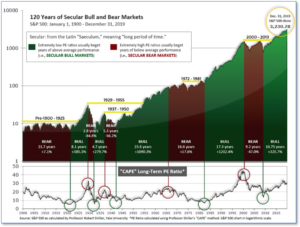
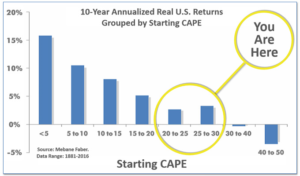
See Fig. 1 for the 100-year view of Secular Bulls and Bears. The CAPE is now at 23.49, down from the prior week’s 23.99 and now well below 30. Since 1881, the average annual return for all ten-year periods that began with a CAPE around the 30 level have been flat to slightly-negative (see Fig. 2).
Note: We do not use CAPE as an official input into our methods. However, if history is any guide – and history is typically ‘some’ kind of guide – it’s always good to simply know where we are on the historic continuum, where that may lead, and what sort of expectations one may wish to hold in order to craft an investment strategy that works in any market ‘season’ … whether current one, or one that may be ‘coming soon’!
The big Picture
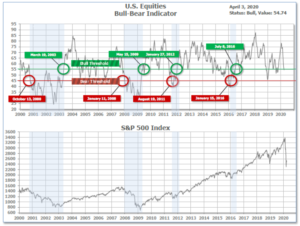
The ‘big picture’ is the (typically) years-long timeframe – the timeframe in which Cyclical Bulls and Bears operate. The U.S. Bull-Bear Indicator is in Cyclical Bull territory at 54.74, down from the prior week’s 56.28.
In the Quarterly- and Shorter-term Pictures
The Quarterly-Trend Indicator based on the combination of U.S. and International Equities trend-statuses at the start of each quarter – was Negative entering April, indicating negative prospects for equities in the second quarter of 2020. (On the ‘daily’ version of the Quarterly-Trend Indicator, where the intra-quarter status of the Indicator is subject to occasional change, both the U.S. Equities and International Equities readings remain in ‘Down’ status; the daily International reading turned to Down on Thursday, Feb. 27th; the U.S. daily reading turned to Down on Friday, Feb. 28th.)
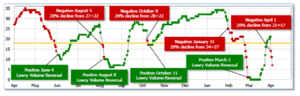
Next is the indicator for U.S. Equities, in the shortest time frame. The indicator turned Negative on April 1, and ended the week at 7, down from the prior week’s 19.
The Complete Picture:
Counting-up of the number of all our indicators that are ‘Up’ for U.S. Equities the current tally is that two of four are Positive, representing a multitude of timeframes (two that can be solely days/weeks, or months+ at a time; another, a quarter at a time; and lastly, the {typically} years-long reading, that being the Cyclical Bull or Bear status).
In the Markets:
U.S. Markets: The major indexes closed lower for the week and rounded out their worst monthly and quarterly performances since 2008. The smaller-cap indexes trailed by a large margin, with the small-cap Russell 2000 falling about 7% in a single-session on Wednesday. The Dow Jones Industrial Average gave up 584 points to finish the week at 21,053, a decline of -2.7%. The technology-heavy NASDAQ Composite retreated -1.7%, while the large cap S&P 500 ended down -2.1%. The small-cap Russell 2000 and mid-cap S&P 400 retraced a large portion of last week’s gains finishing down -7.1% and -6.0%, respectively.
International Markets: Canada’s TSX was the only major international index to manage a positive close last week, rising 2%. The United Kingdom’s FTSE 100 retreated -1.7%, while France’s CAC 40 and Germany’s DAX gave up -4.5% and ‑1.1%, respectively. In Asia, China’s Shanghai Composite fell just -0.3%, but Japan’s Nikkei plunged -8.1%. As grouped by Morgan Stanley Capital International, developed markets ended down -3.7%, while emerging markets declined -0.7%
Commodities: After two volatile weeks of trading, Gold ended the week down -0.5% to $1645.70 an ounce. Silver, likewise, finished the week down -0.3% closing at $14.49 per ounce. Crude oil staged a huge rally, soaring 31.8% to finish the week at $28.34 per barrel for West Texas Intermediate crude after having fallen to $20 during the week. Oil prices surged following a tweet from President Donald Trump that he expects Saudi Arabia and Russia to cut production. Copper, viewed by some analysts as barometer of global economic health due to its wide variety of industrial uses, gained 0.94% last week.
March and Q1 Summaries: For the month, the Dow Jones Industrial Average lost -13.7%, while the NASDAQ retreated ‑10.1%. By market cap, the large cap S&P 500 ended down -12.5%, while the mid-cap S&P 400 fell -20.4%, and the small cap Russell 2000 gave up ‑21.9%. In the first quarter of 2020, the Dow declined -23.2%, the NASDAQ fell ‑14.2%, and the S&P 500 ended down ‑20%. The S&P 400 declined a huge -30.0% while the Russell 2000 fell the most, ‑30.9%.
Major international markets were a sea of red in March and the first quarter as a whole as well. Canada’s TSX fell ‑17.7% in March, while the UK’s FTSE gave up -13.8%. France’s CAC 40 and Germany’s DAX lost -17.2% and -16.4%, respectively. China’s Shanghai Composite ended down -4.5% and Japan’s Nikkei declined -10.5%. Developed markets shed -14.1% and Emerging markets declined -15.8%. In the first quarter of 2020, Canada’s TSX fell -21.6%, while the United Kingdom’s FTSE, France’s CAC 40 and Germany’s DAX retreated -24.8%, -26.5%, and -25%, respectively. China’s Shanghai Composite finished down -9.8%, and Japan’s Nikkei lost -20.0%. Developed markets ended down -23.0%, and emerging markets fell -23.9%.
For the month of March, Gold gained 1.9%, but Silver finished the month down -14%. Oil and Copper retreated -54.0% and -12.3%, respectively. In the first quarter of 2020, Gold gained 4.8%, but Silver declined -21%. Oil cratered a huge ‑66.5%, while copper finished down -20%.
U.S. Economic News: The number of Americans who applied for first-time unemployment benefits last week broke the record set just the previous week, soaring an unprecedented 6.6 million. The reading brought the total for the past two weeks to 9,955,000 initial jobless claims. Assuming the labor force remains steady, this implies a staggering 9.6% unemployment rate—close to the 10% peak reached during the Great Recession. In the details, nearly all states saw jobless claims increase last week. Economists predict 25 million or more Americans could lose their jobs in the next few months—temporarily for some, but permanently for others. Even worse, the level of claims may still be under-represented. Some states continue to have trouble processing the huge influx of applications.
The economic fallout from COVID-19 was bigger and quicker than had been expected, the Labor Department reported. The government’s official employment scorecard for March showed a loss of 701,000 jobs, the most since March 2009. Analysts believe that number is certain to get far worse. The Labor Department’s employment summary for last month was gleaned from a survey of business establishments completed in the second week of March, just before the COVID-19 pandemic began to devastate the economy. The April report is on track to be devastating. Employment had risen for a record 113 straight months until the decline in March. The unemployment rate, meanwhile, rose to 4.4% from a 50-year low of 3.5% in February. The huge increase in jobless claims, however, suggests the rate has actually surged to around 10%.
The pace of home-price appreciation increased again in January, according to market data firm S&P CoreLogic. The S&P CoreLogic Case-Shiller 20-city price index posted a 3.1% year-over-year increase in January. The reading was up 2.8% from the previous month. Because of the two-month lag in the data, the effects of the coronavirus pandemic on the housing market are not yet known. In the report, Phoenix led the way with a more than 6.9% annual price gain in January, followed by Seattle, Tampa, and San Diego. In total, 14 of the 20 cities reported higher prices year-over-year in January.
Confidence among the nation’s consumers plunged as the coronavirus outbreak took hold across the country. The Conference Board reported its Consumer Confidence Index cratered 12.6 points last month, the most since August 2011. The reading hit 120.0, its lowest level since July of 2017. The only positive to the report was that analysts had expected an even lower reading of 110.0. Historically, such large drops in confidence have more often than not been associated with an economic recession. Notably, the survey cutoff date was before the record surge in jobless claims, suggesting that confidence will likely continue to slide in the near future. In the details of the report, the decline was led by a 19.9 point drop in consumer expectations, with outlooks for business conditions, job availability, and income all deteriorating. Consumer assessment of the present situation was not nearly as bad, with that index off just 1.6 points. Confidence was down across all demographic groups and most income categories. Furthermore, analysts aren’t expecting any improvement any time soon. Lynn Franco, senior director of economic indicators at the board stated, “March’s decline in confidence is more in line with a severe contraction — rather than a temporary shock — and further declines are sure to follow.” Similarly, Joshua Shapiro, the chief economist at MFR Inc., stated, “This report, along with the earlier downward revision to the March University of Michigan consumer sentiment index, is in all likelihood just a taste of the steep declines that loom ahead.”
The Institute for Supply Management (ISM) reported its manufacturing index fell back into contraction in March as manufacturers began to feel the brunt of the coronavirus. ISM reported its manufacturing index slipped 1.0 point last month to 49.1. Readings below 50 indicate more companies are contracting rather than expanding. Economists had expected a much lower reading of 44. In the report, new orders plummeted 7.6 points to 42.2—the lowest level since March 2009. Employment was also cut at its fastest pace since May 2009. Of note, the gauge that tracks the speed of deliveries indicated a slowdown. Normally this gauge reflects stronger demand, however in this case it is primarily due to supply chain disruptions. The ISM index is compiled from a survey of executives who order raw materials and other supplies for their companies. The gauge tends to rise or fall in tandem with the health of the economy.
International Economic News: Data released this week showed Canada’s economy was beginning to slow even before COVID-19 hit. Statistics Canada reported Canada’s economy expanded by just 0.1% in January as mining, oil and gas extraction, and the retail sector all shrank. The reading was less than economists’ expectations and less than the 0.3% expansion seen in the previous month. Bank of Montreal economist Benjamin Reitzes did note expansion in one sector that he thinks could be poised to continue in the coming months. “One sector that picked up steam with its biggest gain in a year is public administration,” he said. “Expect a lot more of that as the federal and provincial governments step in to support the economy through the COVID-19 shock.”
Across the Atlantic, United Kingdom Prime Minister Boris Johnson has tested positive for the coronavirus and is continuing his self-isolation inside 10 Downing Street while he still shows symptoms. The UK prime minister still reports having a fever and in a video clip said he would continue to stay inside his quarters until it disappears. The health secretary, Matt Hancock, who announced last Friday that he also had the illness, is now out of isolation. The latest official figures showed 3,605 people had died from the disease in the U.K.
On Europe’s mainland, as the coronavirus weighs on the world’s economies, France is rapidly emerging as a test case of whether a country can hasten its recovery from a recession by protecting businesses from going under in the first place. Patrick Artus, chief economist of Paris-based Natixis Bank stated, “The idea is to have no layoffs or company closures, so that when the coronavirus is finally under control the economy can start right back up.” France is hoping to learn a lesson from the 2008 financial crisis, when it didn’t take aggressive steps to support workers and businesses. Unemployment soon jumped to around 10% and stayed high for half a decade. The government is spending 45 billion euros ($50 billion) to pay businesses not to lay off workers.
In a special report published this week, Germany’s panel of economic advisers to the government warned a recession in Europe’s powerhouse is “inevitable”. The German Council of Economic Advisers said that because the country is in virtual lockdown a recession will be inevitable in the first half of the year. The panel’s baseline model predicts a 2.8% drop in GDP this year, however its worst-case scenario stated the economy could contract up to 5.4%. Right now, almost 1 in 5 German companies say they are at acute risk of insolvency due to the coronavirus crisis. German lawmakers approved an $831.6 billion aid package to help cushion the impact of the pandemic by aiming to keep firms afloat and many workers employed on a short-term basis.
In Asia, China appears to have changed its tone and is now claiming to be ready to work with the United States to help control the spread of the pandemic. Hua Chunying, a spokeswoman for the Chinese Foreign Ministry stated, “The two heads of state agreed that under current circumstances, China and the U.S. should stand united and fight Covid-19.” She noted that Ma Xiaowei, the minister of China’s National Health Commission, spoke on Monday with Alex M. Azar II, the U.S. secretary of health and human services, “to exchange ideas on the two countries’ pandemic prevention and control efforts.”
Japan’s Prime Minister Shinzo Abe and his ruling Liberal Democratic Party agreed that the government will provide 300,000 yen ($2800 USD) in cash to each household suffering from falling incomes amid the spread of the coronavirus. About 10 million of Japan’s 58 million households are expected to be eligible for the cash program, a key pillar of an emergency economic package that the government plans to compile. Unlike a similar initiative in the US, the government will not set a household income limit for the tax-free cash handout, according to the officials. Abe has said the package to tackle the coronavirus will be larger than the 56.8 trillion yen emergency package compiled in April 2009 following the previous year’s global financial crisis.
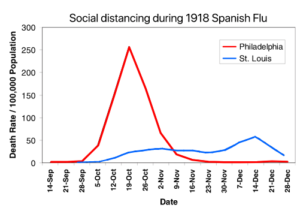
Finally: As the coronavirus continues to spread around the world, officials are studying the quickest and most effective way to contain its spread. With experts saying a vaccine is least 18 months away and no definitive cures or preventatives, the most effective seems to be avoiding social contact as much as possible, or “social distancing”. But does it work? For data we go back to a previous epidemic that swept across the nation, the 1918 Spanish flu. Among the hardest hit cities was Philadelphia, where the infection rate skyrocketed after a huge parade attended by 200,000 Philadelphians was allowed by the Mayor and Health Commissioner to occur even though the flu had already started to take hold in the city. Immediately afterward, the city’s health care system was overrun, and the sick and dying were left with no place to get treatment. However, the city of St. Louis practiced immediate and extreme social distancing, closing schools, movie theaters, sporting events, and public gatherings just 2 days after the flu hit that city. The result was that the flu spread much more slowly throughout St. Louis than in Philadelphia, and that saved thousands of lives. The point of social distancing is to infect all those who are destined to be infected much more slowly, instead of all at once. This saves lives by avoiding overrunning hospital capacity. When a deluge of sick patients present themselves to hospitals all at once, many of the sick can’t be treated and are left to die at home and in the streets. Philadelphia experienced a multiple of the death rate of St. Louis simply because in St. Louis all the sick that needed hospitalization were able to be absorbed by the health care system and treated, albeit over a longer period of time. Dr. Max Starkloff, St. Louis’ Health Commissioner, is still remembered there for his strong will and tremendous foresight. Chart from Scott Sievert (stsievert.com).
(Sources: All index- and returns-data from Yahoo Finance; news from Reuters, Barron’s, Wall St. Journal, Bloomberg.com, ft.com, guggenheimpartners.com, zerohedge.com, ritholtz.com, markit.com, financialpost.com, Eurostat, Statistics Canada, Yahoo! Finance, stocksandnews.com, marketwatch.com, wantchinatimes.com, BBC, 361capital.com, pensionpartners.com, cnbc.com, FactSet.) Securities offered through Registered Representatives of Cambridge Investment Research Inc., a broker-dealer, member FINRA/SIPC. Advisory Services offered through Cambridge Investment Research Advisors, a Registered Investment Adviser. Strategic Investment Partners and Cambridge are not affiliated.
Indices mentioned are unmanaged and cannot be invested into directly. Past performance is no guarantee of future results.