3-30-20 Weekly Market Update
The very Big Picture
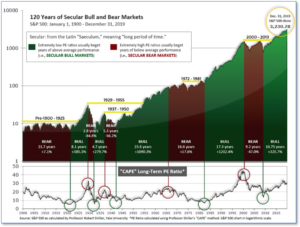
The long-term valuation of the market is commonly measured by the Cyclically Adjusted Price to Earnings ratio, or “CAPE”, which smooths-out shorter-term earnings swings in order to get a longer-term assessment of market valuation. A CAPE level of 30 is considered to be the upper end of the normal range, and the level at which further PE-ratio expansion comes to a halt (meaning that further increases in market prices only occur as a general response to earnings increases, instead of rising “just because”). The market was recently at that level.
Of course, a “mania” could come along and drive prices higher – much higher, even – and for some years to come. Manias occur when valuation no longer seems to matter, and caution is thrown completely to the wind – as buyers rush in to buy first, and ask questions later. Two manias in the last century – the “Roaring Twenties” of the 1920s, and the “Tech Bubble” of the late 1990s – show that the sky is the limit when common sense is overcome by a blind desire to buy. But, of course, the piper must be paid, and the following decade or two were spent in Secular Bear Markets, giving most or all of the mania-gains back.

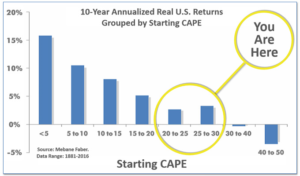
See Fig. 1 for the 100-year view of Secular Bulls and Bears. The CAPE is now at 23.99, up from the prior week’s 21.76 and now well below 30. Since 1881, the average annual return for all ten-year periods that began with a CAPE around the 30 level have been flat to slightly-negative (see Fig. 2).

Note: We do not use CAPE as an official input into our methods. However, if history is any guide – and history is typically ‘some’ kind of guide – it’s always good to simply know where we are on the historic continuum, where that may lead, and what sort of expectations one may wish to hold in order to craft an investment strategy that works in any market ‘season’ … whether current one, or one that may be ‘coming soon’!
The Big Picture:
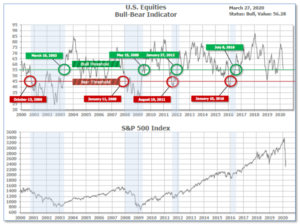
The ‘big picture’ is the (typically) years-long timeframe – the timeframe in which Cyclical Bulls and Bears operate. The U.S. Bull-Bear Indicator is in Cyclical Bull territory at 56.28, down from the prior week’s 57.26.

In the Quarterly- and Shorter-term Pictures:
The Quarterly-Trend Indicator based on the combination of U.S. and International Equities trend-statuses at the start of each quarter – was Positive entering January, indicating positive prospects for equities in the first quarter of 2020 as a whole. (On the ‘daily’ version of the Quarterly-Trend Indicator, where the intra-quarter status of the Indicator is subject to occasional change, both the U.S. Equities and International Equities readings remain in ‘Down’ status; the daily International reading turned to Down on Thursday, Feb. 27th; the U.S. daily reading turned to Down on Friday, Feb. 28th.)
Next is the indicator for U.S. Equities, in the shortest time frame. The indicator is Positive at 19, up from the prior week’s 5.

As a reading of our Bull-Bear Indicator for U.S. Equities (comparative measurements over a rolling one-year timeframe), we remain in Cyclical Bull territory.
The Complete Picture:
Counting-up of the number of all our indicators that are ‘Up’ for U.S. Equities (see Fig. 3), the current tally is that four of four are Positive, representing a multitude of timeframes (two that can be solely days/weeks, or months+ at a time; another, a quarter at a time; and lastly, the {typically} years-long reading, that being the Cyclical Bull or Bear status).
In the Markets:
U.S. Markets: Stocks rebounded from multi-year lows, as investors appeared encouraged by the aggressive monetary policy actions and unprecedented level of fiscal stimulus. On Tuesday, the Dow Jones Industrial Average had its best day since 1933, while the S&P 500 index experienced its largest daily increase since October 2008 with all the major indexes surging by 9% to 13%. By the close of trading Thursday, the Dow had marked its best three-day stretch since 1931. For the week, the Dow Jones Industrial Average rose 2,463 points to close at 21,637, a gain of 12.8%. The Nasdaq Composite rebounded 9.1% closing at 7,502. By market cap, the large cap S&P 500 rose 10.3%, while the midcap S&P 400 and small cap Russell 2000 rallied 13.1% and 11.6%, respectively.
International Markets: The rebound affected all international markets as well with every major market finishing the week in the green. Canada’s TSX rose 7.1% after five consecutive weeks of selling, while the United Kingdom’s FTSE 100 added 6.2%. On Europe’s mainland France’s CAC 40 and Germany’s DAX rose 7.5% and 7.9%, respectively. In Asia, China’s Shanghai Composite managed just a 1.0% gain but it was Japan’s Nikkei that surged the most, rebounding a whopping 17.1%. As grouped by Morgan Stanley Capital International, developed markets rose 12.3% while emerging markets added 6.3%.
Commodities: In commodities, Gold managed to retrace almost all of the last two weeks of losses. The precious metal rebounded 11.4% finishing the week at $1654.10. Similarly, silver rebounded 17.4% to $14.53 an ounce. Energy was unable to manage a rebound, finishing down for a fifth consecutive week. West Texas Intermediate crude oil ended the week down -4.95% to $21.51 per barrel. The industrial metal copper, viewed by some analysts as a barometer of world economic health due to it variety of uses, finished the week essentially unchanged.
U.S. Economic News: The number of Americans seeking first-time unemployment benefits soared to an all-time high last week of over 3 million, the Labor Department reported. The latest reading of 3.28 million shattered the peak during the Great Recession of 665,000 and the all-time peak of 695,000 hit in October of 1982. Consensus estimates from economists had expected claims to total 1.5 million, though a few individual forecasts on Wall Street had been anticipating a much higher number. The surge came amidst the crippling slowdown brought on by the coronavirus crisis. The four-week moving average of claims, which smooths out the weekly volatility, rose 27,500 to 1,731,000. Continuing claims, which counts the number of Americans already receiving benefits, rose by 101,000 to 1.8 million. That number is reported with a one-week delay.
The number of newly-constructed homes sold in February declined 4.4% from the previous month, the government reported. The Commerce Department reported new homes sold at a seasonally-adjusted annual rate of 765,000 last month, and revised January’s figure up to the highest pace of sales since June of 2007 (right before the real estate bubble burst). Compared with the same time last year, new-home sales were up 14.3%. In the details of the report, the median sales price of new homes sold was $345,900. Furthermore, the inventory of new homes for sale dropped to 319,000 which represents a 5.0 months’ supply of homes available on the market. A six-month supply is generally considered a “balanced” housing market. By region, the West saw a 17% decline in new home sales, while the Midwest experienced a 7% decrease. The Northeast experienced a 39% surge in sales, while sales rose 1% in the South.
Not surprisingly, the optimism of the nation’s consumers sank precipitously to its lowest level in four years as the coronavirus outbreak continues to wreak havoc on the economy. The University of Michigan reported its Consumer Sentiment Index fell 11.9 points to 89.1 in March—essentially in line with forecasts. The reading was its weakest since October 2016, and it is expected to fall even further as the COVID-19 pandemic continues. Analysts note that the realization that the COVID-19 pandemic would bring the economy to a halt only began to set in in the latter half of the month. Furthermore, the survey noted that Americans’ expectations for the economy over the next six months fell as well, from 92.1 to 79.7—also the lowest since late 2016.
Research firm IHS Markit reported U.S. businesses were dealt a severe blow this month due to “massive disruptions” from the pandemic. In its “flash” reading (the preliminary reading based on roughly 85% of survey respondents), Markit reported business in the U.S. posted its biggest contraction in March since the end of the Great Recession. The much larger services side of the U.S. economy suffered the biggest hit, as many retailers, hotels, restaurants, and other companies that rely on foot traffic have either been closed or forced to cut back hours. The flash services index sank 10.3 points to 39.1—its lowest level recorded since similar data became available in October of 2009. Markit’s flash index for the manufacturing sector declined 1.5 points to 49.2. Although exports have suffered, most manufacturers are continuing to make necessary items and some large companies are even shifting production to make critical medical equipment. Andrew Hunter, senior U.S. economist at Capital Economics noted that, unlike most “typical” recessions the restrictions on going out in public “suggest that the services sector will continue to fare worse than manufacturing over the coming months.”
Orders for goods expected to last at least 3 years, so-called “durable goods”, posted their biggest gain since last summer in February, but that was mostly due to a spike in demand for new cars and trucks. The Commerce Department reported orders jumped 1.2% last month, however overall orders for most other products declined. Analysts suggest that worries over the coronavirus outbreak were already starting to take a bite out of business. Excluding transportation, durable goods orders were actually off -0.6% in February. Core capital goods orders, a closely followed measure of business investment, dropped -0.8%. Analysts believe the decline in orders for most products aside from autos is probably an indication of what is to come. Andrew Grantham at CIBC Capital Markets wrote in a note to clients, “Orders for durable goods will likely see sharper drops in the coming months as the bigger impacts of COVID-19 on the economy are felt.”
International Economic News: The Bank of Canada lowered its target for the overnight rate by 50 basis points to 0.25%, providing much-needed support to Canada’s financial system and economy. The COVID-19 pandemic is having serious economic consequences for Canadians, slowing its economy and contributing to the plunge in energy prices (the energy sector makes up roughly 10% of Canada’s economy). In addition, Canada is ramping up its asset purchasing programs with its national housing agency, CMHC, announcing it will buy up to $150 billion ($107 billion USD) of mortgages from banks—triple the amount announced just two weeks ago. The announcements came as analysts spoke of the need for more government intervention. Andrew Kelvin, senior Canada rates strategist at Toronto-Dominion Bank stated “More stimulus is needed because of the size of the output gap, and the credit market stresses mean that QE (quantitative easing) is the ideal way of providing that stimulus.”
Across the Atlantic, the United Kingdom’s Prime Minister Boris Johnson has tested positive for the coronavirus and is experiencing “mild symptoms”. Johnson is the first major governmental leader known to have contracted the disease. Johnson said via Twitter that he had developed “a temperature and a persistent cough”, and that he would self-isolate at home. He stated there’s no doubt that he will still “lead the national fight back against coronavirus.” U.K. Health Secretary Matt Hancock said he also tested positive for the virus.
On Europe’s mainland, France’s economy is operating at about 65% of capacity due to the coronavirus outbreak, the French national statistics agency (INSEE) stated. INSEE gave its first picture of the impact of the nationwide lockdown as it published its monthly business confidence index. The reading revealed the single biggest drop since records began in 1980. The index fell 10 points to 95, with even steeper declines seen in the services and retail sectors. The French government has prepared a 45 billion Euro ($49.1 billion) package – 2% of GDP – of crisis measures made up mainly of deferred taxes and payroll charges for companies, and payments to companies who put workers on reduced schedules. Additionally, the government is guaranteeing up to 300 billion euros – 15% of GDP – of corporate borrowing from commercial banks to keep credit flowing to the economy.
Morale among Germany’s businesses plunged to its lowest level since 2009, Germany’s Ifo Institute reported. Furthermore, the latest reading was its steepest fall since the country’s reunification in 1990. In the report, the German Ifo business climate index fell almost 10 points to 86.1 in March. In the report the research institute wrote “The German economy is in shock.” In addition, expectations among German companies have “darkened as never before”. Following the release, Carsten Brzeski, chief economist at ING Germany wrote in a note to clients, “It should not come as a surprise to anyone but economic data for March and beyond will be horrible and probably even beyond the traditional meaning of horrible.”
Chinese President Xi Jinping called on leaders of the Group of 20 nations for greater international coordination of macroeconomic policy to restore confidence in the global economy in the wake of the coronavirus pandemic. Leaders from the major world economies, including the U.S., Japan and Germany held an extraordinary meeting via video conference to respond to the global pandemic. “Countries need to leverage and coordinate their macro policies to counteract the negative impact and prevent the world economy from falling into recession,” Xi said. A Chinese foreign ministry official said that as part of that, China will deploy $344 billion, mainly in fiscal measures. In his speech, Xi called on member nations to cut tariffs, remove barriers and support smooth flow of trade. He also called for better coordination of financial regulation to keep global financial markets stable, and efforts to keep global supply chains stable.
Japan’s government downgraded its assessment of the economy saying it was in a “severe situation”. For the first time in six years, Japan’s Cabinet Office did not use the expression “recovering” to describe the domestic economic situation in its monthly report. The Japanese economy is in “a severe situation, extremely depressed by the novel coronavirus,” it said, while revising down its views on 7 of the 11 main categories including private consumption and business investment. Yasutoshi Nishimura, minister in charge of economic and fiscal policy stated, “We are aware that the moderate recovery trend has clearly turned down and (the economy) has entered a downward phase.”
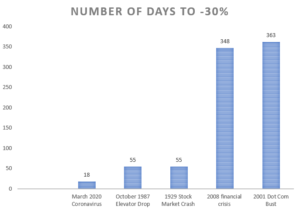
Finally: The speed of the stock market plunge over the last six weeks has left both the general public and even market experts in a state of shellshock. February and March 2020 will go down in history as containing the fastest descent into bear market territory on record. In only sixteen sessions, the S&P 500 went from its last closing high (on February 19), to a more than 20% drop from that peak. Furthermore, to hit a 30% decline it took just 19 sessions. Both the stock market crash of 1929 and infamous October 1987 took a much-longer 55 days to reach the same milestone. Chart from Knox Ridley via Marketwatch.com.

(Sources: All index- and returns-data from Yahoo Finance; news from Reuters, Barron’s, Wall St. Journal, Bloomberg.com, ft.com, guggenheimpartners.com, zerohedge.com, ritholtz.com, markit.com, financialpost.com, Eurostat, Statistics Canada, Yahoo! Finance, stocksandnews.com, marketwatch.com, wantchinatimes.com, BBC, 361capital.com, pensionpartners.com, cnbc.com, FactSet.) Securities offered through Registered Representatives of Cambridge Investment Research Inc., a broker-dealer, member FINRA/SIPC. Advisory Services offered through Cambridge Investment Research Advisors, a Registered Investment Adviser. Strategic Investment Partners and Cambridge are not affiliated.
Indices mentioned are unmanaged and cannot be invested into directly. Past performance is no guarantee of future results.
