
4-13-20 Weekly Market Update
The Very Big Picture
The long-term valuation of the market is commonly measured by the Cyclically Adjusted Price to Earnings ratio, or “CAPE”, which smooths-out shorter-term earnings swings in order to get a longer-term assessment of market valuation. A CAPE level of 30 is considered to be the upper end of the normal range, and the level at which further PE-ratio expansion comes to a halt (meaning that further increases in market prices only occur as a general response to earnings increases, instead of rising “just because”). The market was recently at that level.
Of course, a “mania” could come along and drive prices higher – much higher, even – and for some years to come. Manias occur when valuation no longer seems to matter, and caution is thrown completely to the wind – as buyers rush in to buy first, and ask questions later. Two manias in the last century – the “Roaring Twenties” of the 1920s, and the “Tech Bubble” of the late 1990s – show that the sky is the limit when common sense is overcome by a blind desire to buy. But, of course, the piper must be paid, and the following decade or two were spent in Secular Bear Markets, giving most or all of the mania-gains back.
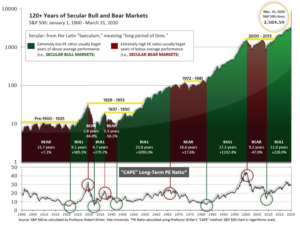
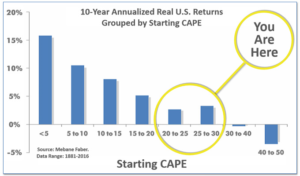
See Fig. 1 for the 100-year view of Secular Bulls and Bears. The CAPE is now at 26.32, up from the prior week’s 23.49 and now well below 30. Since 1881, the average annual return for all ten-year periods that began with a CAPE around the 30 level have been flat to slightly-negative (see Fig. 2).
Note: We do not use CAPE as an official input into our methods. However, if history is any guide – and history is typically ‘some’ kind of guide – it’s always good to simply know where we are on the historic continuum, where that may lead, and what sort of expectations one may wish to hold in order to craft an investment strategy that works in any market ‘season’ … whether current one, or one that may be ‘coming soon’!
The Big Picture:
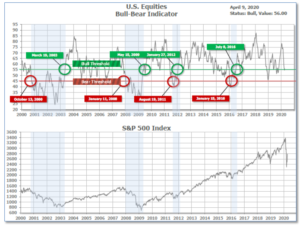
The ‘big picture’ is the (typically) years-long timeframe – the timeframe in which Cyclical Bulls and Bears operate. The U.S. Bull-Bear Indicator is in Cyclical Bull territory at 56.00 up from the prior week’s 54.74.
In the Quarterly- and Shorter-term Pictures
The Quarterly-Trend Indicator based on the combination of U.S. and International Equities trend-statuses at the start of each quarter – was Negative entering April, indicating negative prospects for equities in the second quarter of 2020. (On the ‘daily’ version of the Quarterly-Trend Indicator, where the intra-quarter status of the Indicator is subject to occasional change, both the U.S. Equities and International Equities readings remain in ‘Down’ status; the daily International reading turned to Down on Thursday, Feb. 27th; the U.S. daily reading turned to Down on Friday, Feb. 28th.)
Next is the indicator for U.S. Equities, in the shortest time frame. The indicator turned positive on April 6th, and ended the week at 29, up a very large 22 from the prior week’s 7.
The Complete Picture:
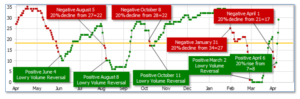
Counting-up of the number of all our indicators that are ‘Up’ for U.S. Equities (see Fig. 3), the current tally is that three of four are Positive, representing a multitude of timeframes (two that can be solely days/weeks, or months+ at a time; another, a quarter at a time; and lastly, the {typically} years-long reading, that being the Cyclical Bull or Bear status).
In the Markets
U.S. Markets: U.S. stocks recorded one of their best weekly gains on record, as some encouraging trends in global coronavirus infection and hospitalization rates lifted hopes that stay-at-home orders might soon be eased. The Dow Jones Industrial Average rose almost 2,670 points to close at 23,719, a gain of 12.7%. The technology-heavy NASDAQ Composite rose 10.6% and finished at 8,154. By market cap, the large cap S&P 500 gained 12.1%, while the mid cap S&P 400 and small cap Russell 2000 surged 18.6% and 18.5%, respectively.
International Markets: International markets, though not as strong as their U.S. counterparts, were nonetheless also a sea of green following last week’s declines. Canada’s TSX rose 9.5% while the United Kingdom’s FTSE added 7.9%. On Europe’s mainland France’s CAC 40 added 8.5%, Germany’s DAX rose 10.9%, and Italy’s Milan FTSE gained 7.6%. In Asia, China’s Shanghai Composite added 2.2% and Japan’s Nikkei rallied 8.6%. As grouped by Morgan Stanley Capital International, developed markets rose 9.2% while emerging markets added 6.7%.
Commodities: Gold hit its highest level in seven years, rising 6.5% to close at $1752.80 an ounce. Silver also rallied, gaining 10.8% to close at $16.05. Oil, however, retraced most of last week’s increase, plunging almost 20% to finish the week at $22.76 per barrel of West Texas Intermediate. The industrial metal copper, viewed by some analysts as an indicator of world economic health due to its wide variety of uses, rose for a third consecutive week by gaining 3.1%.
U.S. Economic News: There was no respite from the coronavirus outbreak for the labor market. The number of Americans seeking first-time unemployment benefits posted another near-record level of 6.606 million last week, far above the consensus forecast of 4.5 million. Optimists note that the number of new claims were 261,000 fewer than the week before, but that’s hardly a sign of a turn-around. Over the last three weeks, more than 16.8 million jobs have been lost. And analysts don’t expect these numbers to let up anytime soon. Economists Dante DeAntonio and Matt Colyar of Moody’s Analytics stated, “The harsh reality is that the level of initial unemployment insurance claims is unlikely to recede in the coming weeks.” The current pace of job losses suggest the unemployment rate will soon move past 15% and perhaps even exceed 20% – levels not seen since the Great Depression of the 1930s.
With millions of jobs lost and large parts of the economy shutdown, the confidence expressed by the nation’s consumers has plunged to a nine-year low. The University of Michigan reported its Consumer Sentiment Index dropped 18.1 points to 71 in early April—its biggest-ever one-month decline. The rapid spread of COVID-19 has arguably delivered the deepest blow to the U.S. economy since the Great Depression. Just two months ago, the index stood close to a 15-year high. If the crisis continues, the survey may very well fall below its previous record low of 55.3, recorded in 2008 in the midst of the Financial Crisis.
The National Federation of Independent Business (NFIB) reported its Small Business Optimism Index plunged a record 8.1 points in March to 96.4—its lowest reading since October 2016. The NFIB reported large numbers of smaller firms scaled back operations or shut down altogether amid the spread of COVID-19 and social distancing. Nine of the ten NFIB components decreased. In the report the NFIB noted that firms are expecting a steep decline in sales over the next three months. Plans for capital expenditures dropped to their lowest point since January 2013 and hiring expectations fell by the most on record.
According to minutes from the Federal Reserve’s two policy meetings in early March, the central bank stated its worst‑case scenario for the economy is “no recovery until next year.” Staff economists stated there were two plausible scenarios for the U.S. economy dealing with the coronavirus outbreak. One scenario sees a recovery begin to take place in the second half of 2020. The more adverse scenario is an economic recovery “much slower to take hold and not materially under way until next year”. Under both scenarios, inflation is expected to move lower. Faced with these scenarios, Fed officials slashed interest rates to zero and launched open-ended purchases of Treasury and asset-backed securities. Since March 15, the Fed has taken several additional steps to get funds into all corners of the financial system, introducing six lending facilities. The central bank is also working on a program to make loans to medium-size businesses.
Prices declined at the producer level for a second consecutive month, though less than expected. The Producer Price Index for final demand fell -0.2% in March. Analysts had expected a decline of -0.4%. The weakness was primarily in goods prices, which dropped 1%. Nearly all of it was due to lower energy prices, reflecting the steep drop in oil prices. Food prices were flat. Year-over-year, the PPI for final demand was up just 0.7% – the least since August 2016.
Prices also fell at the consumer level, the most since early 2015. The Consumer Price Index declined -0.4% in March. Analysts had expected a decline of -0.3%. Energy prices fell -5.8%, reflecting the sharp drop in oil prices. Food, on the other hand, rose in price by 0.3%. Core CPI, which excludes the often-volatile food and energy categories, fell -0.1%, down for the first time since January 2010. The declines in prices for apparel, transportation services, and new vehicles were notable as social distancing and stay-at-home orders slashed consumer shopping and travel. On an annual basis, the CPI eased to 1.5%, its slowest pace in over a year.
International Economic News: Bank of Canada Governor Stephen Poloz said he would have stayed beyond his soon-to-expire term to help manage the economic fallout from the COVID-19 pandemic, but he was never asked. Mr. Poloz announced he wouldn’t seek a second term when his current seven-year mandate ends on June 2. There had been some speculation that Mr. Poloz would be asked to remain in charge of the bank longer in light of the COVID-19 shock, which has created deep economic uncertainty and triggered unprecedented actions by the bank to combat the fallout. The Bank of Canada has confirmed that a special committee of independent directors of the bank’s board continues the formal search process for Mr. Poloz’s successor. The final decision on the next governor will be made by Prime Minister Justin Trudeau and Finance Minister Bill Morneau.
Across the Atlantic, United Kingdom Prime Minister Boris Johnson is out of the intensive care unit as he continues to recover from coronavirus. Johnson, 55, was admitted to St. Thomas’ Hospital last Sunday with a persistent high temperature and cough. Johnson was the first world leader to be hospitalized with coronavirus, forcing him to hand control of the world’s fifth-largest economy to Foreign Secretary Dominic Raab, just as the UK’s outbreak approaches what experts expect will be its most deadly peak. Raab told a news conference it was too early to end the nation’s lockdown because Britain had not yet reached the peak of the outbreak. The UK death toll from coronavirus has crossed the 10,000 mark.
Germany and France, the EU’s two largest economies, are bracing for a painful recession as the coronavirus pandemic slashes output to the lowest levels in decades, according to forecasts this week. Gross domestic product in export powerhouse Germany is expected to shrink by nearly 10% in the second quarter as shutdowns aimed at slowing the outbreak paralyze the global economy, the country’s leading research institutes said in a report. The second-quarter plunge in GDP will be twice as big as any during the 2008-2009 financial crisis and would mark the steepest fall since the institutes’ records began in 1970. “The corona pandemic will trigger a serious recession in Germany,” the six institutes including Ifo, DIW and RWI said, estimating that the economy already contracted by 1.9% year-on-year in the first quarter.
France is already in a technical recession, the Bank of France said. Official data showed the French economy shrank 0.1% in the last quarter of 2019, and the central bank estimates it contracted around 6% in the first three months of 2020. French economic activity plunged a staggering 32% in the last two weeks of March as the coronavirus crisis intensified. Bank of France governor Francois Villeroy de Galhau warned that April was expected to be “at least as bad” as late March. “Economic growth will be strongly negative in 2020” before bouncing back in 2021, he added.
Investors are looking to China for clues about when the global economy will pick up once the spread of the coronavirus slows and lockdowns lift. Official reports from the Chinese government, a set of closely followed purchasing managers’ indexes, recently showed that Chinese manufacturing and service-sector activity unexpectedly expanded in March after suffering the worst contractions on record in February. However, China has long been suspected of manipulating its economic data. For answers, analysts turn to data collected by observations from space by New York-based, SpaceKnow. Their data, based on infrared data from more than 5000 locations across China’s supply chain, shows deep, ongoing contraction. SpaceKnow’s Broad Activity Index stands at -0.2. That is the lowest point since reports emerged of the coronavirus in Wuhan. “The SpaceKnow data suggest a continued slowing in China’s economy, despite official data saying otherwise,” says Jeremy Fand, SpaceKnow’s chief executive.
Japanese Prime Minister Shinzo Abe declared a state of emergency this week to fight new coronavirus infections and unveiled a stimulus package he described as among the world’s biggest. The state of emergency gives authorities more power to press people to stay at home and businesses to close. “If each of us can reduce contact with other people by at least 70%, and ideally by 80%, we should be able to see a peak in the number of infections in two weeks,” he said. The government also approved the stimulus package worth 108 trillion yen ($990 billion) — equal to 20% of Japan’s economic output — to cushion the impact of the epidemic on the world’s third-largest economy. That exceeds the equivalent of 11% of U.S. output for the stimulus package laid out by President Donald Trump and 5% of output for Germany’s package.
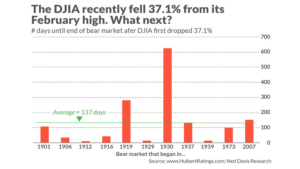
Finally: With stocks surging this week and now more than 20% higher from their mid-March lows, many wonder whether the great coronavirus bear market of 2020 is now history or whether the stock market will hit a new low later this year. Mark Hulbert, writing for MarketWatch, looked at past bear markets for the answer and is convinced the answer is “lower low later”. The Dow fell by more than 37% from February’s high to its March low; market data shows such declines have occurred 11 other times in history. On average across those 11, as shown on the chart below, the final bear market low came 137 days after first registering such a loss. Adding that average number of days to the day of the March low projects another potentially lower low on Aug. 7. (Chart from MarketWatch.com)
(Sources: All index- and returns-data from Yahoo Finance; news from Reuters, Barron’s, Wall St. Journal, Bloomberg.com, ft.com, guggenheimpartners.com, zerohedge.com, ritholtz.com, markit.com, financialpost.com, Eurostat, Statistics Canada, Yahoo! Finance, stocksandnews.com, marketwatch.com, wantchinatimes.com, BBC, 361capital.com, pensionpartners.com, cnbc.com, FactSet.) Securities offered through Registered Representatives of Cambridge Investment Research Inc., a broker-dealer, member FINRA/SIPC. Advisory Services offered through Cambridge Investment Research Advisors, a Registered Investment Adviser. Strategic Investment Partners and Cambridge are not affiliated.
Indices mentioned are unmanaged and cannot be invested into directly. Past performance is no guarantee of future results.