
4-5-21 Weekly Market Update
The very Big Picture
The long-term valuation of the market is commonly measured by the Cyclically Adjusted Price to Earnings ratio, or “CAPE”, which smooths-out shorter-term earnings swings in order to get a longer-term assessment of market valuation. A CAPE level of 30 is considered to be the upper end of the normal range, and the level at which further PE-ratio expansion comes to a halt (meaning that further increases in market prices only occur as a general response to earnings increases, instead of rising “just because”). The market was recently at that level.
Of course, a “mania” could come along and drive prices higher – much higher, even – and for some years to come. Manias occur when valuation no longer seems to matter, and caution is thrown completely to the wind – as buyers rush in to buy first, and ask questions later. Two manias in the last century – the “Roaring Twenties” of the 1920s, and the “Tech Bubble” of the late 1990s – show that the sky is the limit when common sense is overcome by a blind desire to buy. But, of course, the piper must be paid, and the following decade or two were spent in Secular Bear Markets, giving most or all of the mania-gains back.
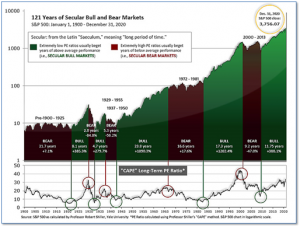
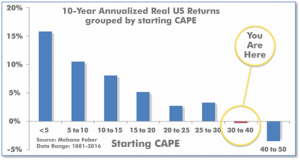
See Fig. 1 for the 100-year view of Secular Bulls and Bears. The CAPE is now at 36.16, up from the prior week’s 35.75. Since 1881, the average annual return for all ten-year periods that began with a CAPE in the 30-40 range has been slightly negative (see Fig. 2).
Note: We do not use CAPE as an official input into our methods. However, if history is any guide – and history is typically ‘some’ kind of guide – it’s always good to simply know where we are on the historic continuum, where that may lead, and what sort of expectations one may wish to hold in order to craft an investment strategy that works in any market ‘season’ … whether current one, or one that may be ‘coming soon’!
The Big Picture:
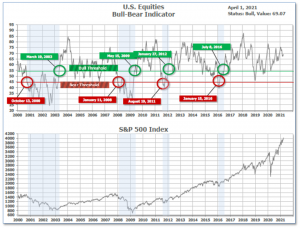
The ‘big picture’ is the (typically) years-long timeframe – the timeframe in which Cyclical Bulls and Bears operate. The U.S. Bull-Bear Indicator is in Cyclical Bull territory at 69.07 up from the prior week’s 67.85.
In the Quarterly- and Shorter-term Pictures
The Quarterly-Trend Indicator based on the combination of U.S. and International Equities trend-statuses at the start of each quarter – was Positive on March 31, indicating positive prospects for equities in the first quarter of 2021.
Next, the short-term(weeks to months) Indicator for US Equities turned positive on March 31 and ended the week at 14, up from the prior week’s 12.
In the Markets:
U.S. Markets: The major U.S. benchmarks ended the holiday-shortened week higher. The large-cap S&P 500 index crossed the 4,000 threshold for its first time, and the mid cap S&P 400 also set a new intraday record. The technology-heavy NASDAQ Composite led the advance, rebounding after selling off the most among U.S. indices in the first quarter. The Dow Jones Industrial Average rose 80 points finishing the week at 33,153—a gain of 0.2%. The NASDAQ Composite jumped 2.6% to 13,480. By market cap, the large cap S&P 500 added 1.1%, while the mid cap S&P 400 and small cap Russell 2000 rose 0.8% and 1.5%, respectively.
International Markets: Canada’s TSX rose 1.3%, while the United Kingdom’s FTSE 100 ticked down -0.1%. On Europe’s mainland, France’s CAC 40 rose 1.9%, while Germany’s DAX jumped 2.4%. In Asia, China’s Shanghai Composite added 1.4% and Japan’s Nikkei added 0.7%. As grouped by Morgan Stanley Capital International, developed markets added 0.3%, while emerging markets tacked on 1.1% for the week.
Commodities: Precious metals ended the week down. Gold ticked down -0.2% to $1728.40 an ounce, while Silver finished down -0.7% to $24.95 per ounce. Energy was bid higher following three down weeks. West Texas Intermediate crude oil rose 0.8% to $61.45 per barrel. The industrial metal copper, viewed by some analysts as a barometer of world economic health due to its wide variety of uses, fell for a third consecutive week, ending down -1.9%.
March Summary: In the U.S., the Dow Jones Industrials led the way with a 6.6% gain, followed by mid caps (up 4.5%) and large caps (up 4.2%). Small caps (the Jan + Feb leader) rose 0.9% and the NASDAQ added 0.4%. Canada’s TSX added 3.5% while the UK added 3.6%. France and Germany rose a nice 6.4% and 8.9%, respectively, while China declined -1.9% and Japan ticked up 0.7%. For the month, developed markets rose 2.5% while emerging markets fell ‑0.7%. Most commodities fared poorly in March. Gold and silver declined -0.8% and -7.2%, respectively, while oil gave up -3.4% and copper fell -2.4%.
First Quarter Summary: In the U.S., the Dow rose 7.8% and the NASDAQ added 2.8%. The big winners were mid and small caps, by a large margin. By market cap, large caps rose 5.8%, while mid caps and small caps gained 13.1% and 12.4%, respectively. Canada gained 7.3% and the UK added 3.9%. France and Germany rose 9.3% and 9.4%, respectively, while China ticked down -0.9% and Japan rose 6.3%. As grouped by Morgan Stanley Capital International, developed markets finished the quarter up 3.9%, while emerging markets added 2.6%. Despite their supposed role as an inflation hedge, gold and silver ended the quarter down -9.5% and -7.1%, respectively. Two commodities tied to economic activity did very well: copper gained 13.5% and oil surged 21.9%.
U.S. Economic News: The number of Americans filing for first-time unemployment benefits rose at the end of the March, but economists expect the increase is just a temporary blip. The Bureau of Labor Statistics reported initial jobless claims jumped by 61,000 to 719,000 in the week ended March 27th. Economists had expected new claims to fall to a seasonally-adjusted 675,000. New claims increased the most in Virginia, along with smaller increases in Kentucky, Georgia, New Jersey and California. They declined the most in Ohio, Massachusetts and Florida. The number of people already collecting unemployment benefits declined to 46,000 to 3.79 million. These so-called “continuing claims” are now at their lowest level in a year. Analysts are expecting a quick rebound in the labor market. Senior economist Bill Adams of PNC Financial Services stated, “Job growth will accelerate dramatically in coming months as the U.S. reaches herd immunity and the high-contact service sector revives.”
The U.S. economy added 916,000 new jobs in March signaling a much stronger economy going forward. A surge of hiring in the ‘Leisure and Hospitality’ sector followed by the government and construction led to the most new jobs being added in seven months. The growth in jobs easily exceeded economists’ forecasts. Economists had expected just 675,000 new jobs. Economists predict even faster hiring in the months ahead if most Americans get vaccinated and the coronavirus pandemic fades away. Meanwhile, the official unemployment rate slipped 0.2% to 6%. Sal Guatieri of senior economist at BMO Capital Markets stated, “Job growth is now accelerating across the nation, helped by massive fiscal stimulus and a now speedy vaccination program.”
Home prices continued to increase at a double-digit pace around the country according to two separate widely-followed housing market indexes. The S&P CoreLogic Case-Shiller 20-city home price index posted an 11.1% annual gain in January—up from 10.2% the previous month. On a monthly basis, the 20-city index increased 0.9% between December and January. Prices rose on a monthly basis in 19 of the 20 large cities tracked by Case-Shiller. Phoenix saw the highest rate of price appreciation with a 15.8% gain year-over-year, followed by Seattle and San Diego. Cleveland was the only city to see prices drop. Craig Lazzara, managing director and global head of index investment strategy at S&P DJI said in the report, “January’s data remain consistent with the view that COVID has encouraged potential buyers to move from urban apartments to suburban homes.” In addition, the broader Case-Shiller national price index which covers the entire country, posted an 11.2% year-over-year gain in January—its biggest monthly increase in almost 15 years. Separately, the Federal Housing Finance Agency released its own home-price index which showed a 12% increase in home prices nationwide compared to a year ago and a 1% uptick month-over month.
An indicator of future activity in the housing market showed far fewer Americans signed deals to purchase homes in February than economists had expected. The National Association of Realtors (NAR) reported its index of pending home sales fell 10.6% in February—the fifth consecutive month in which this measure declined. The index tracks real-estate transactions in which a contract has been signed but the sale has not yet closed. The median forecast of economists had called for a 3.1% decline in pending sales on a monthly basis. Compared to 2020, pending sales were down 0.5%, representing the first annual decline in eight months. Pending home sales fell in every region of the country. The South notched the largest decline, with a 13% monthly decrease, while the West had the smallest drop at 7.4%.
Confidence among the nation’s consumers surged in March to a one-year high as more Americans got vaccinated and the government distributed $1,400 stimulus checks to boost the economy. The Conference Board reported its index of consumer confidence surged 19.3 points to 109.7 in March from the previous month. Economists had expected a smaller increase to just 96.8. For perspective, the index had stood at a 20-year high of 132.6 in February of 2020, shortly before the onset of the coronavirus pandemic. The part of the survey that tracks how consumers feel about the economy right now, known as the “present situation index”, jumped to 110 from 89.6. Lynn Franco, senior director of economic indicators at the nonprofit board stated, “Consumers’ renewed optimism boosted their purchasing intentions for homes, autos and several big-ticket items.” Another gauge that assesses how Americans view the next six months–future expectations index–leaped to 109.6 from 90.9. That’s the highest level in 21 months. One growing worry: higher inflation, mainly at the gas pump. That “may temper spending intentions in the months ahead,” Franco said.
Manufacturing activity in the U.S. grew faster in March as a key index hit a 38-year high, pointing to further momentum in the U.S. economy. The Institute for Supply Management (ISM) reported its manufacturing index jumped to 64.7 from 60.8 in the prior month. Readings over 50 indicate growth, while anything over 55 is considered exceptional. The increase far surpassed Wall Street’s expectations of 61.7. In the details, the improvement in manufacturing activity was widespread across almost all industries. Seventeen of the 18 industries tracked by ISM expanded in March, with most reporting increases in production, new orders and employment. The biggest problems manufacturers face right now are shortages of some key supplies – and workers – that are hindering production and raising prices. Finding enough skilled workers, especially in a pandemic, has also been a chronic problem. In the report, a senior executive at a maker of transportation equipment stated, “Business conditions are positive for our industry and company. The constraints are mainly related to parts availability. Manpower is also a constraint. Hiring new workers is a challenge.”
International Economic News: The Canadian economy grew 0.7% in January and appears to have grown almost as much in February, Statistics Canada said. The January reading of real GDP compared with a gain of just 0.1% in December, and topped the agency’s preliminary estimate for the month of 0.5%. It was the ninth consecutive monthly increase since the plunge in the economy last year in March and April when workers were ordered home and non-essential businesses forced to close. Almost one year later, Statistics Canada reports total economic activity was still about 3% below the February level last year. The agency’s preliminary estimate for February this year showed growth of 0.5% for the month. In a research note, TD Bank senior economist Sri Thanabalasingam said January was a solid month for the Canadian economy and “the first quarter of 2021 is shaping out to be a very good one for Canada.”
Across the Atlantic, the United Kingdom’s economic recovery in the second half of last year was stronger than expected according to official figures which also showed that households put more money in savings account than previous data suggested. The UK’s Office for National Statistics (ONS) said the economy expanded by 16.9% and 1.3% in the third and fourth quarters of 2020, respectively. This marked steep increases on initial estimates of 16.1% and 1.0%. Analysts said the more robust recovery than first estimated by the ONS gave hope for a broader expansion during 2021 as the economy continues to gain momentum.
On Europe’s mainland, French President Emmanuel Macron ordered France into its third national lockdown this week, and said schools would close for three weeks as he worked to slow a third wave of COVID-19 infections that threatened to overwhelm the nation’s hospitals. With the death toll nearing 100,000, intensive care units in the hardest-hit regions at breaking point and a slower-than-planned vaccine rollout, Macron was forced to abandon his goal of keeping the country open to protect the economy. “We will lose control if we do not move now,” the president said in a televised address to the nation. His announcement means that movement restrictions already in place for more than a week in Paris, and some northern and southern regions, will now apply to the whole country for at least a month.
Germany lead the increase in economic sentiment in the Eurozone, which surged much more than expected in March. The European Commission’s monthly Economic Sentiment Indicator (ESI) survey showed economic sentiment in the 19 countries sharing the Euro jumped to 101 points in March from 93.4 in February, beating economists’ forecasts of a rise to 96 points. “For the first time since the outbreak of COVID-19 on the continent, the ESI is … slightly above its long-term average,” the Commission said. “The increases were of a magnitude not seen since last summer’s steep recovery following the first phase of the pandemic.” The Commission said that among the largest EU economies, Germany stood out with the largest monthly sentiment improvement on record of 7.9 points to 103.7 points.
In Asia, China’s economic recovery continued in March, driven by a better-than-expected surge in the services sector. China’s non-manufacturing purchasing managers’ index (PMI)–a gauge of sentiment in the service and construction sectors–rose to a four-month high of 56.3 in March from 51.4 in February, according to data released by China’s National Bureau of Statistics. In addition, its official manufacturing PMI—a survey of sentiment among factory owners in the world’s second largest economy—rose to 51.9 in March from 50.6 in February. Readings above 50 indicate growth in activity, while a reading below the 50 mark represents contraction. “After the Lunar New Year, the recovery of production accelerated, and the manufacturing industry rebounded significantly in March,” said Zhao Qinghe, a senior statistician at the NBS.
A closely watched economic survey by the Bank of Japan shows growing optimism over the outlook for the world’s third-largest economy. The central bank’s quarterly “tankan” survey’s headline index for larger manufacturers’ sentiment stood at positive 5 in March—a considerable improvement over the negative 10 reading in December. The reading exceeded economists’ estimates of 4. The survey demonstrated the steady recovery in sentiment over the last three quarters, back to the levels reached just before the coronavirus pandemic took hold. The tankan measures corporate sentiment by subtracting the number of companies saying business conditions are negative from those responding they are positive. Sentiment among large non-manufacturers improved by four points to -1, but represents a much slower improvement in sentiment than among manufacturers.
Finally: Volkswagen pulled an early April Fool’s joke on the world when it announced that it was henceforth changing its name to “Voltswagen”. Later, VW admitted it was indeed an April Fool’s joke, but it certainly succeeded in drawing attention to VWs very large ambitions in the Electric Vehicle (EV) industry. In fact, around the globe VW has been gaining market share rather sharply, and the consulting firm Wood Mackenzie predicts that VW will become the world’s largest EV producer by the end of this decade, producing about half of the total EV unit output. (Chart from chartr.co)

(Sources: All index- and returns-data from Yahoo Finance; news from Reuters, Barron’s, Wall St. Journal, Bloomberg.com, ft.com, guggenheimpartners.com, zerohedge.com, ritholtz.com, markit.com, financialpost.com, Eurostat, Statistics Canada, Yahoo! Finance, stocksandnews.com, marketwatch.com, wantchinatimes.com, BBC, 361capital.com, pensionpartners.com, cnbc.com, FactSet.) Securities offered through Registered Representatives of Cambridge Investment Research Inc., a broker-dealer, member FINRA/SIPC. Advisory Services offered through Cambridge Investment Research Advisors, a Registered Investment Adviser. Strategic Investment Partners and Cambridge are not affiliated. Indices mentioned are unmanaged and cannot be invested into directly. Past performance is no guarantee of future results.