
4-12-21 Weekly Market Update
The very Big Picture
The long-term valuation of the market is commonly measured by the Cyclically Adjusted Price to Earnings ratio, or “CAPE”, which smooths-out shorter-term earnings swings in order to get a longer-term assessment of market valuation. A CAPE level of 30 is considered to be the upper end of the normal range, and the level at which further PE-ratio expansion comes to a halt (meaning that further increases in market prices only occur as a general response to earnings increases, instead of rising “just because”). The market was recently at that level.
Of course, a “mania” could come along and drive prices higher – much higher, even – and for some years to come. Manias occur when valuation no longer seems to matter, and caution is thrown completely to the wind – as buyers rush in to buy first, and ask questions later. Two manias in the last century – the “Roaring Twenties” of the 1920s, and the “Tech Bubble” of the late 1990s – show that the sky is the limit when common sense is overcome by a blind desire to buy. But, of course, the piper must be paid, and the following decade or two were spent in Secular Bear Markets, giving most or all of the mania-gains back.
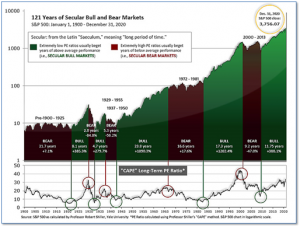
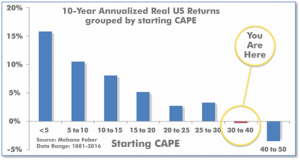
See Fig. 1 for the 100-year view of Secular Bulls and Bears. The CAPE is now at 37.09, up from the prior week’s 36.16. Since 1881, the average annual return for all ten-year periods that began with a CAPE in the 30-40 range has been slightly negative (see Fig. 2).
Note: We do not use CAPE as an official input into our methods. However, if history is any guide – and history is typically ‘some’ kind of guide – it’s always good to simply know where we are on the historic continuum, where that may lead, and what sort of expectations one may wish to hold in order to craft an investment strategy that works in any market ‘season’ … whether current one, or one that may be ‘coming soon’!
The Big Picture:
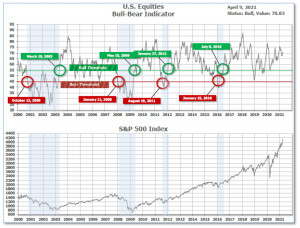
The ‘big picture’ is the (typically) years-long timeframe – the timeframe in which Cyclical Bulls and Bears operate. The U.S. Bull-Bear Indicator is in Cyclical Bull territory at 70.83 up from the prior week’s 69.07.
In the Quarterly- and Shorter-term Pictures
The Quarterly-Trend Indicator based on the combination of U.S. and International Equities trend-statuses at the start of each quarter – was Positive on March 31, indicating positive prospects for equities in the first quarter of 2021.
Next, the short-term(weeks to months) Indicator for US Equities turned positive on March 31 and ended the week at 14, up from the prior week’s 12.
In the Markets:
U.S. Markets: Most of the major U.S. benchmarks moved steadily to new record highs this week, although the small-cap Russell 2000 index recorded a modest loss. The Dow Jones Industrial Average rose 2% to finish the week at 33,801, while the technology-heavy NASDAQ Composite rallied 3.1% to close at 13,900. By market cap, the large cap S&P 500 finished up 2.7%, while the mid-cap S&P 400 added 0.9%. The small-cap Russell 2000 finished down -0.5%.
International Markets: Canada’s TSX rose 1.3%, while the United Kingdom’s FTSE 100 gained 2.6%. On Europe’s mainland, France’s CAC 40 and Germany’s DAX added 1.1% and 0.8%, respectively. In Asia, China’s Shanghai Composite retreated -0.5%. Japan’s Nikkei finished the week up 1.3%. As grouped by Morgan Stanley Capital International, developed markets closed the week up 1.5%, emerging markets retreated -0.6%.
Commodities: Precious metals found firm footing while trading in a narrow range for a fourth consecutive week. Gold rose $16.40 to $1744.80 an ounce, while Silver finished the week up 1.5% to $25.33 per ounce. Energy declined for a fourth time in five weeks. West Texas Intermediate crude oil fell -3.5% to $59.32 per barrel. Copper, viewed by some analysts as a barometer of world economic health due to its wide variety of industrial uses, ended the week up 1.2%.
U.S. Economic News: The number of Americans filing first-time unemployment benefits rose by 16,000 to 744,000 last week, according to the Labor Department. Economists had expected claims would fall to 694,000. New claims rose sharply in California and New York. There were more modest declines in Ohio and Texas. Continuing claims, which counts the number of people already receiving benefits, declined by 16,000 to a seasonally-adjusted 3.09 million. That’s the lowest level for continuing claims in a year. Despite the recent tick-up, claims are expected to continue to trend lower as the economy re-opens and more Americans are vaccinated.
The number of job openings in the U.S. hit their highest level in more than two years as the economy continued to reopen. The Labor Department’s Job Openings and Labor Turnover Survey (JOLTS) showed that job openings jumped to 7.37 million from 7.1 million in January. Job openings rose the most in February in health care, hotels, restaurants, theaters, museums and parks and recreation. The so-called ‘quits rate’, rumored to be closely watched by the Federal Reserve as it is assumed a worker would only quit a position in favor of a more lucrative one, remained unchanged at 2.6% among private-sector employees and is back to pre-crisis levels. At the height of the coronavirus crisis, the quits rate had fallen to a seven-year low of 1.8%.
Activity in the services side of the U.S. economy, which makes up more than two-thirds of U.S. economic output, soared in March as governments lifted businesses restrictions and rising vaccinations gave Americans more confidence to go out and shop, travel or take a vacation. A survey of business leaders at service-oriented firms such as banks, retailers and restaurants jumped to 63.7 last month from 55.3 in February, the Institute for Supply Management (ISM) reported. The month-over-month jump was the highest on record since ISM began the survey in 1997. All 18 services industries tracked by the ISM expanded in March. In the details of the report, new orders and production made big leaps as each sub-index also hit their highest levels on record.
Orders for U.S. manufactured goods fell -0.8% in February, the Commerce Department reported. This was the first decline since the depths of the coronavirus recession last April. Economists were expecting just a -0.6% decline. Orders for so-called ‘durable goods’—items expected to last at least three years—fell a revised -1.2% in February. Orders for ‘non-durable goods’ were down -0.4% for the month. Economists blamed the weakness in February on cold weather. Analysts also suggested the lack of key supplies may also have placed a role.
According to minutes of their March meeting released this week, Federal Reserve officials seemed divided almost evenly over their outlook for inflation. “Several” Fed officials said that supply bottlenecks and strong demand would push up price inflation “more than anticipated,” the minutes said. At the same time, “several” other Fed officials expressed belief that the factors that had contributed to low inflation over the past decade “could again exert more downward pressure on inflation than expected.” The Fed upgraded its forecast for growth and employment and forecast that headline inflation would rise to 2.4% rate this year — above the 2% target — but then settle down to 2.1% by 2023. Despite these changes, the Fed’s median forecast was for no liftoff in interest rates through 2023.
International Economic News: Canada’s economy added more than 300,000 jobs in March, once again outpacing expectations and putting the labor market on track to recoup all that was lost one year ago. Statistics Canada reported the economy added 303,000 jobs in March as restrictions were rolled back. Retail gained 95,000 jobs to fully recoup losses sustained in January lockdowns, while employment jumped 21,000 in the accommodation and food services sector. Notable gains were also seen in health care, construction and educational services. The March increase puts overall employment 296,000 shy of the pre-COVID level in February 2020. Furthermore, the unemployment rate was 7.5%, a pandemic-era low.
Across the Atlantic, United Kingdom Prime Minister Boris Johnson stated he’s “hopeful” that foreign travel can resume in mid-May. Johnson also confirmed that shops, hairdressers, gyms and outdoor hospitality venues like pubs could open beginning April 12 as planned. Johnson said a task force this week will set out a “reasonable” plan on nonessential travel abroad. England has been in lockdown mode since late December as a result of the coronavirus pandemic, with international travel restricted. Once traveling abroad is allowed, quarantine rules will depend on a “traffic light system” – meaning that those traveling to countries on a “green” list will not be required to isolate upon their return to the U.K. Johnson said it was too soon to say which countries would be on which list.
On Europe’s mainland, French Economy Minister Bruno LeMaire said the French economy will expand by 5% in 2021, as a third lockdown to combat a resurgence of coronavirus cases prompted a downward revision in the previous forecast for 6% growth. The new forecast was prudent, LeMaire said in comments published in Le Journal Du Dimanche (JDD). “Our fundamentals are sound; we will be able to bounce back,” LeMaire said. French schools and non-essential stores such as clothing chain stores will now be shut for four weeks, after COVID-19 cases surged in recent weeks.
Industrial production in Germany dropped for a second consecutive month in February, official data showed. The Economy Ministry said that production was down 2% compared with the previous month. The unexpected decline followed a 1.6% drop in January. Analysts suggested a bout of harsh winter weather that weighed on construction may have been a factor. ING economist Carsten Brzeski wrote in a research note, “It is hard to see how the German economy could escape a contraction in the first quarter.” However, the ministry said that increasing business confidence and increases in factory orders point to “a positive outlook for industrial activity in the coming months.”
In a new report by the U.S. intelligence community, China is said to be on track to surpass the United States as the world’s largest economy and advance down a path toward reclaiming a global power role within the next two decades. In its report entitled, “Global Trends 2040: A More Contested World”, the Office of the Director of National Intelligence (ODNI) forecasted future trends that would transform the international community nearly 20 years down the road. Among the central factors used to weigh how the world would change was that of the relationship between its top two powers: Washington and Beijing. Among the most sizable shifts foreseen in the global order was the transfer of the economic balance power from West to East, with Asian economies gaining more ground. The report forecast that China would be at the top, increasing its share of the world’s Gross Domestic Product (GDP) from 17.9% in 2020 to 22.8% in 2040.
Japan’s household spending dropped for a third straight month in February, suggesting the effects of COVID-19 are still weighing on Japan’s economy. Emergency curbs to prevent the spread of the coronavirus weighed on consumption and raised the risk of a more prolonged and bumpier economic recovery, analysts say. Analysts are forecasting an economic contraction in the first quarter as a state of emergency in Tokyo and some other areas to contain a renewed spike in coronavirus cases pressures businesses, especially the service sector such as restaurants and hotels. Household spending dropped 6.6% in February from a year earlier—economists had expected just a 5.3% decline. However, analysts are optimistic about the future. Toru Suehiro, senior economist at Daiwa Securities stated, “Consumer spending is expected to pick up in March and April due to pent-up demand after the government’s lifting a state of emergency and hopes for the coronavirus vaccine.”
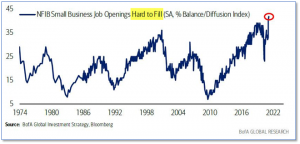
Finally: “Signs, signs, everywhere a sign” sang the 70’s Canadian rock group Five Man Electrical Band. The sign that is everywhere now is “Help Wanted”! The latest data from the Bureau of Labor Statistics shows there are over 100 million Americans who are currently out of the labor force. But of that group, just 6.85 million people are currently looking for a job. Why are less than 7% of available workers looking for a job? Interviews reveal the prevailing attitude: it pays darn well to not work! The trillions of dollars in government stimulus are now incentivizing potential workers not to seek gainful employment, but to sit back and collect the next “stimmy check” for not working. The chart below, from Bank of America’s Global Research department, plots the National Federation of Independent Business (NFIB) “Hard to Fill” job openings category. As can be seen, the current level of 40 is the highest in the history of the index.
(Sources: All index- and returns-data from Yahoo Finance; news from Reuters, Barron’s, Wall St. Journal, Bloomberg.com, ft.com, guggenheimpartners.com, zerohedge.com, ritholtz.com, markit.com, financialpost.com, Eurostat, Statistics Canada, Yahoo! Finance, stocksandnews.com, marketwatch.com, wantchinatimes.com, BBC, 361capital.com, pensionpartners.com, cnbc.com, FactSet.) Securities offered through Registered Representatives of Cambridge Investment Research Inc., a broker-dealer, member FINRA/SIPC. Advisory Services offered through Cambridge Investment Research Advisors, a Registered Investment Adviser. Strategic Investment Partners and Cambridge are not affiliated. Indices mentioned are unmanaged and cannot be invested into directly. Past performance is no guarantee of future results.