
4-26-21 Weekly Market Update
The very Big Picture
The long-term valuation of the market is commonly measured by the Cyclically Adjusted Price to Earnings ratio, or “CAPE”, which smooths-out shorter-term earnings swings in order to get a longer-term assessment of market valuation. A CAPE level of 30 is considered to be the upper end of the normal range, and the level at which further PE-ratio expansion comes to a halt (meaning that further increases in market prices only occur as a general response to earnings increases, instead of rising “just because”). The market was recently at that level.
Of course, a “mania” could come along and drive prices higher – much higher, even – and for some years to come. Manias occur when valuation no longer seems to matter, and caution is thrown completely to the wind – as buyers rush in to buy first, and ask questions later. Two manias in the last century – the “Roaring Twenties” of the 1920s, and the “Tech Bubble” of the late 1990s – show that the sky is the limit when common sense is overcome by a blind desire to buy. But, of course, the piper must be paid, and the following decade or two were spent in Secular Bear Markets, giving most or all of the mania-gains back.
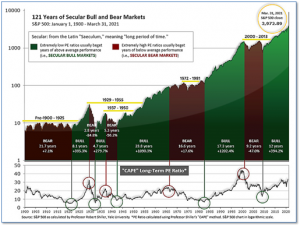
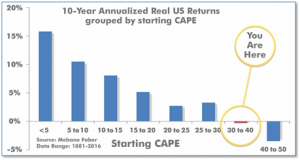
See Fig. 1 for the 100-year view of Secular Bulls and Bears. The CAPE is now at 37.56, slightly down from the prior week’s 37.60. Since 1881, the average annual return for all ten-year periods that began with a CAPE in the 30-40 range has been slightly negative (see Fig. 2).
Note: We do not use CAPE as an official input into our methods. However, if history is any guide – and history is typically ‘some’ kind of guide – it’s always good to simply know where we are on the historic continuum, where that may lead, and what sort of expectations one may wish to hold in order to craft an investment strategy that works in any market ‘season’ … whether current one, or one that may be ‘coming soon’!
The Big Picture:
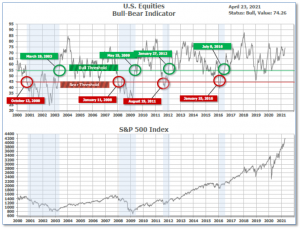
The ‘big picture’ is the (typically) years-long timeframe – the timeframe in which Cyclical Bulls and Bears operate. The U.S. Bull-Bear Indicator is in Cyclical Bull territory at 74.26 up from the prior week’s 72.66.
In the Quarterly- and Shorter-term Pictures
The Quarterly-Trend Indicator based on the combination of U.S. and International Equities trend-statuses at the start of each quarter – was Positive on March 31, indicating positive prospects for equities in the first quarter of 2021.
Next, the short-term(weeks to months) Indicator for US Equities turned negative on April 20 and ended the week at 15, down from the prior week’s 22.
In the Markets:
U.S. Markets: Domestic markets finished the week little changed, with some of the lightest daily trading volumes of the year. Mid- and small-caps performed better than large caps, and the technology-heavy Nasdaq Composite Index modestly lagged the broad market. The Dow Jones Industrial Average finished the week down -157 points, a decline of ‑0.5%. The technology-heavy NASDAQ Composite ended the week down -0.3%, following three consecutive weeks of gains. By market cap, the large cap S&P 500 ticked down -0.1%, while the mid cap S&P 400 and small cap Russell 2000 rose by 0.9% and 0.4%, respectively.
International Markets: A majority of major international markets finished the week to the downside. Canada’s TSX declined ‑1.3%, while the United Kingdom’s FTSE 100 ended down -1.2%. On Europe’s mainland, France’s CAC 40 retreated -0.5%, while Germany’s DAX fell -1.2%. In Asia, China’s Shanghai Composite rose 1.4%, but Japan’s Nikkei finished the week down -2.2% – its second consecutive decline. As grouped by Morgan Stanley Capital International, developed markets finished down -0.3%, while emerging markets rose 0.5%.
Commodities: Gold ended the week down just -0.1%, finishing at $1777.80 per ounce, while Silver also declined ‑0.1% to $26.08. Oil retraced some of last week’s advance. West Texas Intermediate crude oil declined -1.7% to $62.14 per barrel. The industrial metal copper, viewed by some analysts as a barometer of world economic health due to its wide variety of uses, surged 4% this week.
U.S. Economic News: The number of Americans filing for first-time unemployment benefits fell again last week, the second consecutive significant decline. The Labor Department reported initial jobless claims fell by 39,000 to 547,000—its lowest level since mid-March 2020. Economists had expected 603,000 new claims. The four-week moving average for claims, which smooths out volatility, fell 27,750 to 651,000. That is also the lowest level since last March. Declines in claims were widespread across the country with particularly sharp declines in Texas and New York. Continuing claims, which counts the number of Americans already receiving benefits, declined by 34,000 to a seasonally adjusted 3.67 million. That’s also the lowest level since last March.
Sales of existing homes pulled back for a second month reflecting the challenges buyers continue to face in the current fiercely competitive real-estate market. The National Association of Realtors (NAR) reported existing home sales fell 3.7% in March to a seasonally-adjusted annual rate of 6.01 million. It was the lowest rate of home sales since August. Still, compared with the same time last year, home sales are up more than 12%. Lawrence Yun, NAR chief economist, said in the report, “The sales for March would have been measurably higher, had there been more inventory. Without an increase in supply, the society wealth division will widen with homeowners enjoying sizable equity gains while renters will struggle to become homeowners.” Sales fell across every region, with the largest decline occurring in the West–where they dropped 8% since February. Currently, there’s a 2.1 month supply of homes on the market. A 6-month supply is generally considered a “balanced” housing market.
Sales of new homes surged past expectations as builders raced to meet demand. The Census Bureau reported new home sales occurred at a seasonally-adjusted annual rate of 1.021 million in March. It was the fastest pace of new home sales since 2006. Sales rose 20.7% from February, and compared with the same time last year sales have more than doubled. The median forecast had been for a sales rate of 888,000. Sales rates increased in every part of the country, except the West where they fell 30%. The largest sales gain occurred in the South, with a 40% jump. Analysts don’t expect the shortage in housing to end anytime soon. Rubeela Farooqi, chief U.S. economist at High Frequency Economics wrote in a research note, “While mortgage rates are a significant factor for home purchases, the biggest issue currently seems to be inventories, and it will continue to be a headwind in the near term.”
The “flash” U.S. Composite Purchasing Managers’ Index (PMI) hit a record high, indicating the U.S. economy is firing on all cylinders. Analytics firm IHS Markit reported its flash reading composite PMI rose to 62.2 in April from 59.7 in March. In the details, the services side of the PMI rose to a record 63.1 in April from 60.4 in March, while the manufacturing side hit a record 60.6, up from 59.1 the previous month. Manufacturing output jumped, despite unprecedented supply chain disruptions, while service sector growth was driven by strong client demand and the reopening of core businesses. The flash estimate is typically based on approximately 85%–90% of total survey responses each month.
International Economic News: The Bank of Canada opted to keep its benchmark interest rate steady at record low 0.25% this week, saying the pandemic recovery “continues to require extraordinary monetary policy support.” However, at the same time, it significantly increased its growth estimates now forecasting 6.5% growth this year—up from an earlier prediction of 4%. Furthermore, the bank said it intends to hold the policy interest rate until the economy is recovered which may occur in the second half of 2022—moved up from its earlier prediction of 2023. Benjamin Reitzes, Canadian rates and macro strategist at BMO Capital Markets, said in a note to clients, “The Bank of Canada has made a drastic U-turn in the space of three months from being extremely cautious to be being extremely upbeat.”
Across the Atlantic, the United Kingdom’s economy showed signs of rebounding strongly as companies reported surging demand and officially data highlighted rising consumer confidence. The flash, or interim, composite PMI published by the research group IHS Markit and the Chartered Institute of Procurement and Supply rose to 60 in April, from 56.4 in the previous month. Furthermore, retail sales in Great Britain rose 5.4% in March compared with the previous month, data from the Office for National Statistics showed. Chris Williamson, chief business economist at IHS Markit, said: “Companies are reporting a surge in demand for both goods and services as the economy opens up from lockdowns and the encouraging vaccine rollout adds to a brighter outlook.”
On Europe’s mainland, business activity in France expanded more strongly than forecast in April, as the Eurozone’s second-biggest economy shows signs of resilience to the pandemic. IHS Markit said its preliminary composite PMI for April rose to 51.7 points from 50 in March, beating a consensus analyst forecast for 48.8 points. Eliot Kerr, an economist at IHS Markit, said in a statement, “With an expansion in services activity and another strong rise in manufacturing production during April, the French private sector finally managed to achieve growth.” The positive momentum in the French economy came from the services sector, with a slight slowdown in manufacturing.
In the space of a few years, Germany’s Green Party has gone from being on the fringes of the political establishment to gaining in popularity and prominence. This week a new Forsa/RTL/n-tv opinion poll showed Germany’s Green Party had taken a seven-point lead over Chancellor Angela Merkel’s conservatives, which if sustained, could see the Greens seize power from the center-right CDU/CSU alliance. The Green Party says it will revise Germany’s so-called “debt brake”, which is enshrined in the Basic Law and prevents governments from taking on too much new debt. Although Merkel’s administration has broken these rules to cover COVID-19-related costs, it has committed to return to a balanced budget by 2022. The Greens, on the other hand, say the current low-interest environment will allow a far bigger investment in the green economy. The party has pledged to spend €500 billion ($600 billion) over the next decade on the “socioecological transformation” of the economy.
In Asia, an adviser to China’s central bank has warned that China’s population is set to peak in just four years’ time, and the milestone will be marked by a significant downturn in consumer demand. Ai Fang, a member of the monetary policy committee of the People’s Bank of China (PBOC), was quoted as saying in a report, “When the total population enters negative growth [after 2025], there will be a shortage of demand.” “We need to pay attention to the impact of demographics on future consumption.” Cai said the number of Chinese of working age had been in decline since 2010, which has mainly affected the supply side of the economy…so far. His comments came after the PBOC recently published a paper highlighting the imminent problems caused by China’s falling birth rate and calling for further liberalization of the two-child policy and an increase in support measures for women to encourage them to have more babies.
Japan declared a third state of emergency for Tokyo and three western prefectures this week amid skepticism it will be enough to curb a rapid coronavirus resurgence just three months ahead of the Olympics. Prime Minister Yoshihide Suga announced the emergency for Tokyo, Osaka, Kyoto and Hyogo from April 25 through May 11. The step is largely intended to be “short and intensive” to stop people from traveling and spreading the virus during Japan’s “Golden Week” holidays from late April through the first week of May, Suga said. Japan’s third state of emergency since the pandemic began comes only a month after an earlier emergency ended in the Tokyo area. For days, experts and local leaders said ongoing semi-emergency measures have failed and tougher steps are urgently needed.
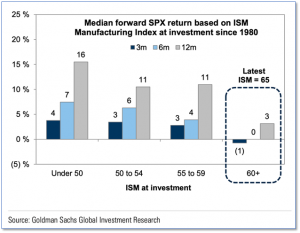
Finally: Strategists at investment bank behemoth Goldman Sachs recently noted that their economists expect U.S. GDP growth to remain above trend through the next few quarters; however, they caution that this will not necessarily translate to equally outsize gains in the stock market. In the chart below, stock market gains for the following 3, 6 and 12 month periods are grouped by Institute for Supply Management (ISM) index values at the start of the periods. What it shows clearly is that the best stock market gains come from good-but-not-spectacular ISM values, while the red-hot “greater than 60” ISM values are typically followed by low or even negative stock market returns. The current ISM value is 65 – squarely in that red-hot category.
(Sources: All index- and returns-data from Yahoo Finance; news from Reuters, Barron’s, Wall St. Journal, Bloomberg.com, ft.com, guggenheimpartners.com, zerohedge.com, ritholtz.com, markit.com, financialpost.com, Eurostat, Statistics Canada, Yahoo! Finance, stocksandnews.com, marketwatch.com, wantchinatimes.com, BBC, 361capital.com, pensionpartners.com, cnbc.com, FactSet.) Securities offered through Registered Representatives of Cambridge Investment Research Inc., a broker-dealer, member FINRA/SIPC. Advisory Services offered through Cambridge Investment Research Advisors, a Registered Investment Adviser. Strategic Investment Partners and Cambridge are not affiliated. Indices mentioned are unmanaged and cannot be invested into directly. Past performance is no guarantee of future results.