
4-20-20 Weekly Market Update
The very Big Picture
The long-term valuation of the market is commonly measured by the Cyclically Adjusted Price to Earnings ratio, or “CAPE”, which smooths-out shorter-term earnings swings in order to get a longer-term assessment of market valuation. A CAPE level of 30 is considered to be the upper end of the normal range, and the level at which further PE-ratio expansion comes to a halt (meaning that further increases in market prices only occur as a general response to earnings increases, instead of rising “just because”). The market was recently at that level.
Of course, a “mania” could come along and drive prices higher – much higher, even – and for some years to come. Manias occur when valuation no longer seems to matter, and caution is thrown completely to the wind – as buyers rush in to buy first, and ask questions later. Two manias in the last century – the “Roaring Twenties” of the 1920s, and the “Tech Bubble” of the late 1990s – show that the sky is the limit when common sense is overcome by a blind desire to buy. But, of course, the piper must be paid, and the following decade or two were spent in Secular Bear Markets, giving most or all of the mania-gains back.
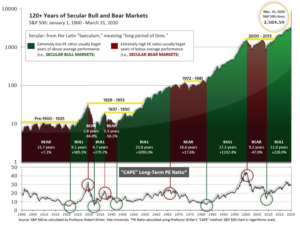
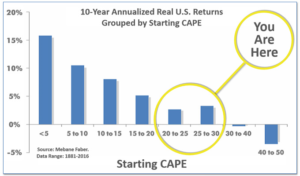
See Fig. 1 for the 100-year view of Secular Bulls and Bears. The CAPE is now at 26.91, up from the prior week’s 26.32 and now well below 30. Since 1881, the average annual return for all ten-year periods that began with a CAPE around the 30 level have been flat to slightly-negative (see Fig. 2).
Note: We do not use CAPE as an official input into our methods. However, if history is any guide – and history is typically ‘some’ kind of guide – it’s always good to simply know where we are on the historic continuum, where that may lead, and what sort of expectations one may wish to hold in order to craft an investment strategy that works in any market ‘season’ … whether current one, or one that may be ‘coming soon’!
The Big Picture:
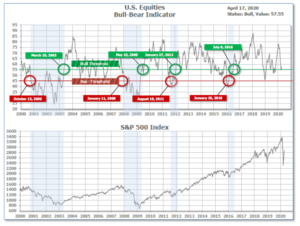
The ‘big picture’ is the (typically) years-long timeframe – the timeframe in which Cyclical Bulls and Bears operate. The U.S. Bull-Bear Indicator is in Cyclical Bull territory at 57.55 up from the prior week’s 56.00.
In the Quarterly- and Shorter-term Pictures
The Quarterly-Trend Indicator based on the combination of U.S. and International Equities trend-statuses at the start of each quarter – was Negative entering April, indicating negative prospects for equities in the second quarter of 2020. (On the ‘daily’ version of the Quarterly-Trend Indicator, where the intra-quarter status of the Indicator is subject to occasional change, both the U.S. Equities and International Equities readings remain in ‘Down’ status; the daily International reading turned to Down on Thursday, Feb. 27th; the U.S. daily reading turned to Down on Friday, Feb. 28th.)
Next is the indicator for U.S. Equities, in the shortest time frame. The indicator turned positive on April 6th, and ended the week at 28, down 1 from the prior week’s 29.
The Complete Picture:
Counting-up of the number of all our indicators that are ‘Up’ for U.S. Equities (see Fig. 3), the current tally is that three of four are Positive, representing a multitude of timeframes (two that can be solely days/weeks, or months+ at a time; another, a quarter at a time; and lastly, the {typically} years-long reading, that being the Cyclical Bull or Bear status).
In the Markets:
U.S. Markets: The major indexes recorded mixed returns, as investors weighed record downturns in economic data against hope that progress in containing the coronavirus might soon result in a partial reopening of the economy. The technology-heavy NASDAQ Composite outperformed by a wide margin, as did growth stocks relative to value shares. The NASDAQ gained 6.1% last week, while the Dow Jones Industrial Average rose 2.2%. By market cap, the large cap S&P 500 rose 3.0%, but the mid cap S&P 400 and small cap Russell 2000 finished down -1.6% and -1.4%, respectively.
International Markets: Canada’s TSX rose 1.4%, while the United Kingdom’s FTSE finished down -1.0%. On Europe’s mainland, France’s CAC 40 ticked down -0.2%, while Germany’s DAX rose 0.6%. In Asia, China’s Shanghai Composite rose 1.5% and Japan’s Nikkei gained 2.0%. As grouped by Morgan Stanley Capital International, developed markets rose 0.3% while emerging markets gained 2.6%.
Commodities: Gold finished the week down in the face of the strength in the equities markets, declining -3.1% to $1,698.80 an ounce. Silver also finished the week down, declining -4.7% to $15.30 per ounce. Oil managed a partial rebound from last week’s plunge. West Texas Intermediate crude oil rose 10% last week to $25.03 per barrel. The industrial metal copper, viewed by some analysts as a barometer of global economic health due to its wide variety of uses, gained 3.8% last week – its fourth consecutive week of gains.
U.S. Economic News: The number of Americans filing for initial unemployment benefits fell by 1.370 million to 5.245 million last week, but the number was still far above the weekly filings seen just over a month ago that were in the low 200,000s. Over the past four weeks, a total of 22.034 million workers have filed for unemployment benefits. That number is consistent with an unemployment rate approaching 20%. How soon most of the newly jobless Americans get back to work will depend on how quickly the economy reopens. President Trump announced federal guidelines on how states can begin to ease restrictions, though many governors say they are not ready to do so with the number of COVID-19 cases still rising.
Confidence among the nation’s home builders plunged to its lowest level since 2012 as the coronavirus outbreak weighed on construction activity. The index from the National Association of Home Builders (NAHB) fell a staggering 42 points to a reading of just 30 in April – down from 72 the month prior. The decline was the largest monthly change in the index’s 30-year history. The monthly index is based on a monthly survey in which the NAHB asks builders to rate various measures regarding the real-estate market as “good,” “fair,” or “poor.” Index readings above 50 indicate improving confidence, while a figure below that threshold would signal the opposite. This is the first time since 2014 that the index has dropped below 50. On a regional basis, builders were the least optimistic in the Northeast, where the index fell 45 points to 19. The Midwest followed with an index of 25. Builders in the South and West were slightly more upbeat, but still had a very poor view of the housing market.
The outbreak of the coronavirus triggered a record -8.7% plunge in March sales at U.S. retailers as large swaths of the economy shut down. The Commerce Department reported sales fell for a second month in what’s likely to be a prolonged period of weakness for an industry that relies heavily on foot traffic and shopping. The reading was even worse than the consensus estimate of -8.0%. Last month’s plunge in sales was more than double the biggest single month decline during the Financial Crisis of 2007-2009. According to government figures, sales plunged -27% at auto dealers and -17% at gas stations, two of the biggest segments of the retail industry. Excluding those categories, sales fell a smaller -3.1%, but the damage was still unprecedented. Receipts plunged 50% at clothing stores, -26.5% at restaurants and -20% at department stores.
Industrial production plunged -5.4% in March, the most since January 1946 and worse than the consensus of -3.5% as many plants either shut down or greatly reduced their operations amid the COVID-19 pandemic. Durable goods manufacturing fell -9.1%, led by vehicle output which plunged -28%, the most since January 2009. Nondurable manufacturing (goods expected to last less than 3 years) was off by a lesser -3.2%. Year-over-year industrial production fell -5.5%, its steepest drop since November 2009. The capacity utilization rate declined a record -4.3% to 72.7%. There was more idle capacity across all three industrial production sectors, but the utilization rate was the lowest in the manufacturing sector.
In the city of Brotherly Love, business activity plunged to a record low this month. The Philadelphia Fed reported its Index of General Business Activity declined -43.9 points to -56.6. The reading was much worse than economists’ forecasts of a 30 point decline. Nearly all of the individual indicators were in deep recession territory. New orders, shipments, and hours worked all contracted at record rates. However, one bright spot was the outlook for growth in the next six months. The index for Future Activity rebounded 7.8 points to 43.0. That suggests manufacturers in the region expect the recession to be short, and growth to return by the end of the year.
It was a similar story in the New York area. The New York Fed reported its Empire State manufacturing index had its second consecutive record decline as the New York-area continued to bear the brunt of the coronavirus pandemic. The Empire State business conditions index collapsed a record -57 points to -78.2 this month. The reading was the lowest on record. Economists had expected a decline of just -35 points. New orders and shipments both declined at a record pace. The only bright spot in the report, similar to the report from Philadelphia, is that firms expect conditions to improve over the next six months.
International Economic News: For the first time ever, Statistics Canada released its GDP data early – and it was the worst on record. Canada’s economy shrank by 9% in March according to a flash estimate. The decline was the most severe since the series first began in 1961. As a result, the reading will drag down growth for the first quarter to -2.6%. The government agency normally only releases GDP data two months after its last reference date. However, given the rapid economic downturn, StatCan felt it was necessary to release the estimate while warning it wasn’t of the “same quality” of the final release and would likely change.
Across the Atlantic, Bank of England Governor Andrew Bailey stated the British economy may be heading for its worst three months since comparable records began. In a conference call with reporters, Bailey said high frequency data monitored by the bank suggested an “unprecedented collapse in GDP” in the second quarter was “quite within the grounds of possibility”. He revealed that the Bank, which will produce its own forecast for the impact of COVID-19 early next month, had been using a tool it created to monitor high frequency data on the UK economy for a potential hard Brexit. That tool, which analyzes credit card spending data, housing market activity, and surveys of household spending in almost real-time; all showed a big drop-off in activity.
On Europe’s mainland, following French President Emmanuel Macron’s decision to extend the nation’s lockdown, Finance Minister Bruno Le Maire said the economy is now expected to contract -8% this year, instead of the earlier ‑6% forecast. The lockdown, which was originally schedule to end this week, is now slated to end May 11. Budget minister Gerald Darmanin said the extension is expected to put additional strain on public finances, blowing the budget deficit out to a post-war record of 9% of GDP. France’s 67 million people have been ordered to stay at home except to buy food, go to work, seek medical care or get some exercise on their own since March 17th.
While other nations are still struggling just to test people for suspected infections, Germany is doing that and more. Germany is aiming to sample the entire population for antibodies in the coming months, hoping to gain insight into how deeply the virus has penetrated the German population, how deadly it really is, and whether immunity may be developing. In Munich, residents of 3,000 households chosen at random are being asked to allow monthly blood tests for Covid-19 antibodies for a year. Researchers hope the data will show them which of the far-reaching social and economic restrictions that have slowed the virus are most effective and which can be safely lifted.
In Asia, China suffered its worst economic contraction since at least the 1970’s in the first quarter of the year as it fought the coronavirus outbreak. The world’s second-largest economy shrank -6.8% from the same time last year in the first three months of the year after factories, shops, and travel were closed to contain the infection. The plunge is the worst for a single quarter that China has recorded since it started publishing those figures in 1992. China’s three major engines for growth — consumer spending, exports and fixed asset investment — all essentially froze as large swaths of the country were placed on lockdown in late January and early February to contain the spread of the virus.
Japan will offer a cash payment of 100,000 yen ($1,461) to every resident, Prime Minister Shinzo Abe announced. “We are moving quickly to deliver cash to all people,” Abe said. Japan has seen relatively few cases and deaths compared to hotspots in Europe and the United States but a recent spike in Tokyo – which logged a daily record 201 new cases on Friday – has sparked concern. The Japanese economy was heading for recession even before the coronavirus crisis, contracting by -1.8% in the final quarter of last year. Since then, tourism has dropped, industry and trade have ground to a halt and the virus forced the postponement of the Tokyo 2020 Olympics that was seen providing a boost to the economy.
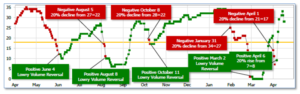
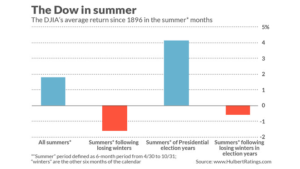
Finally: The stock market’s most favorable six-month period is coming to an end, and unfortunately, there’s not much to show for it. The six-month pattern, known by both the “Halloween Indicator” and the market mantra to “Sell in May and Go Away”, is based on the historical tendency of the market to produce its highest returns during the predominantly winter months and lower average returns during the summer months. Further, in summers following losing winter periods, the returns are not just lower but, on average, negative. In presidential election years (like 2020), the effect isn’t very pronounced, yet still slightly negative. The chart below, from Mark Hulbert via Marketwatch.com, illustrates the phenomenon.
(Sources: All index- and returns-data from Yahoo Finance; news from Reuters, Barron’s, Wall St. Journal, Bloomberg.com, ft.com, guggenheimpartners.com, zerohedge.com, ritholtz.com, markit.com, financialpost.com, Eurostat, Statistics Canada, Yahoo! Finance, stocksandnews.com, marketwatch.com, wantchinatimes.com, BBC, 361capital.com, pensionpartners.com, cnbc.com, FactSet.) Securities offered through Registered Representatives of Cambridge Investment Research Inc., a broker-dealer, member FINRA/SIPC. Advisory Services offered through Cambridge Investment Research Advisors, a Registered Investment Adviser. Strategic Investment Partners and Cambridge are not affiliated.
Indices mentioned are unmanaged and cannot be invested into directly. Past performance is no guarantee of future results.