
4-27-20 Weekly Market Update
The very Big Picture
The long-term valuation of the market is commonly measured by the Cyclically Adjusted Price to Earnings ratio, or “CAPE”, which smooths-out shorter-term earnings swings in order to get a longer-term assessment of market valuation. A CAPE level of 30 is considered to be the upper end of the normal range, and the level at which further PE-ratio expansion comes to a halt (meaning that further increases in market prices only occur as a general response to earnings increases, instead of rising “just because”). The market was recently at that level.
Of course, a “mania” could come along and drive prices higher – much higher, even – and for some years to come. Manias occur when valuation no longer seems to matter, and caution is thrown completely to the wind – as buyers rush in to buy first, and ask questions later. Two manias in the last century – the “Roaring Twenties” of the 1920s, and the “Tech Bubble” of the late 1990s – show that the sky is the limit when common sense is overcome by a blind desire to buy. But, of course, the piper must be paid, and the following decade or two were spent in Secular Bear Markets, giving most or all of the mania-gains back.
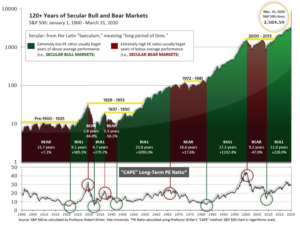
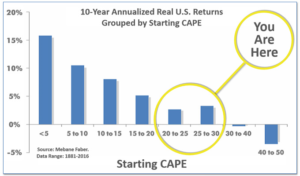
See Fig. 1 for the 100-year view of Secular Bulls and Bears. The CAPE is now at 26.56, down from the prior week’s 26.91 and now well below 30. Since 1881, the average annual return for all ten-year periods that began with a CAPE in the 20-30 range have been slightly-positive to slightly-negative (see Fig. 2).
Note: We do not use CAPE as an official input into our methods. However, if history is any guide – and history is typically ‘some’ kind of guide – it’s always good to simply know where we are on the historic continuum, where that may lead, and what sort of expectations one may wish to hold in order to craft an investment strategy that works in any market ‘season’ … whether current one, or one that may be ‘coming soon’!
The Big Picture:
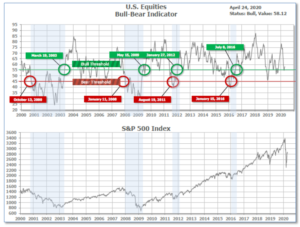
The ‘big picture’ is the (typically) years-long timeframe – the timeframe in which Cyclical Bulls and Bears operate. The U.S. Bull-Bear Indicator is in Cyclical Bull territory at 58.12 up from the prior week’s 57.55.
In the Quarterly- and Shorter-term Pictures
The Quarterly-Trend Indicator based on the combination of U.S. and International Equities trend-statuses at the start of each quarter – was Negative entering April, indicating negative prospects for equities in the second quarter of 2020. (On the ‘daily’ version of the Quarterly-Trend Indicator, where the intra-quarter status of the Indicator is subject to occasional change, both the U.S. Equities and International Equities readings remain in ‘Down’ status; the daily International reading turned to Down on Thursday, Feb. 27th; the U.S. daily reading turned to Down on Friday, Feb. 28th.)
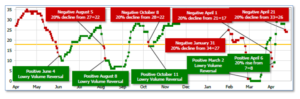
Next is the indicator for U.S. Equities, in the shortest time frame. The indicator turned negative on April 21th, and ended the week at 24, down 4 from the prior week’s 28.
The Complete Picture:
Counting-up of the number of all our indicators that are ‘Up’ for U.S. Equities, the current tally is that two of four are Positive, representing a multitude of timeframes (two that can be solely days/weeks, or months+ at a time; another, a quarter at a time; and lastly, the {typically} years-long reading, that being the Cyclical Bull or Bear status).
In the Markets:
U.S. Markets: Most of the major indexes fell moderately last week as investors digested first-quarter earnings reports and the plunge in oil prices. The Dow Jones Industrial Average gave up 467 points to finish the week at 23,775, a decline of -1.9%. The technology-heavy NASDAQ Composite gave up just -0.2% finishing at 8,635. By market cap, the large cap S&P 500 declined -1.3%, while the mid cap S&P 400 fell -0.7%. The small cap Russell 2000 went the other way, finishing the week in the green, up 0.3%.
International Markets: Canada’s TSX was the only major international market to finish in the green for the week, rising 0.4%. The United Kingdom’s FTSE gave up -0.6%, while France’s CAC 40 and Germany’s DAX declined -2.3% and -2.7%, respectively. In Asia, China’s Shanghai Composite fell -1.1% and Japan’s Nikkei gave up -3.2%. As grouped by Morgan Stanley Capital International, developed markets fell -1.0% while emerging markets declined -1.9%.
Commodities: Precious metals were mixed last week with Gold rising 2.2% to $1735.60 per ounce, while silver declined -0.2% to $15.26 an ounce. Carnage continued in the crude oil market, West Texas Intermediate crude plunged over 32% last week, finishing the week at $16.94 per barrel. The expiring futures contract for oil actually went negative early in the week, wiping out many traders in the process. The industrial metal copper, viewed by some analysts as a barometer of global economic health, declined -0.3%, just its first down week in the last five.
U.S. Economic News: The number of Americans applying for first-time unemployment benefits fell by 810,000 to 4.4 million, but claims remained far above the levels from just five weeks ago. Economists had expected a reading of 4.3 million. The cumulative number of first-time unemployment benefits over the past five weeks has soared to 26.453 million as businesses shuttered across the country in the wake of COVID-19. The spike in unemployment has likely pushed the jobless rate to between 15% and 20%, economists estimate. Continuing claims, which counts the number of Americans already receiving unemployment benefits, came in at a record 15.967 million.
The housing market, a stalwart of the U.S. economy, finally caved under the pressure of social distancing and stay-at-home policies: existing home sales plunged 8.5% in March—its largest decline since November of 2015. Economists had expected a decline of only 7.5%. From the same time last year, home sales were still up 0.8%, but that was the slowest pace since last July. By region, sales declined across the country, led by a double-digit decline in the West. Despite the weaker demand, months of available supply picked up only slightly to 3.4 from 3.0 months as inventories remained tight. Despite the drop in existing home sales, prices continued to rise, up 8.0% year-over-year.
New home sales, likewise, declined 15.4% last month to a 627,000 annual rate—their steepest decline since July 2013. The reading is a ten-month low and below the consensus of a 647,000 unit rate. Sales fell across the country, led by the Northeast and West regions with drops in the 40% range. New home inventory ticked up 2.8% to 333,000 units. However, months of available supply, which relates inventory to current demand, jumped by 1.2 months to 6.4, as demand for new homes weakened significantly. Prices, however, did not budge much. On a year-over-year trend basis, the median new home price increased 4.7%, while the mean price was up 2.8%
The sentiment of the nation’s consumers appeared to stabilize toward the end of this month after suffering its biggest decline on record. The University of Michigan reported that the final reading of its consumer-sentiment survey in April edged up 0.8 point to 71.8. The final reading reflected hopes among Americans that the economy will improve later in the year after the early onslaught from the coronavirus. The stabilization in consumer sentiment mirrors the results of a similar weekly survey by Morning Consult. Of interest, Americans recognize the dire state of the economy at present – the portion of the sentiment survey that examines how Americans view the present has plunged 40.5 points over the past two months. Yet another part of the survey that gauges attitudes for the coming six months has fallen by just half as much. The divergence indicates consumers expect the economy to improve later in the summer.
The latest data from Markit showed both of its flash Purchasing Managers Indexes (PMI) continued to plummet this month. Markit’s PMI for services and manufacturing showed a stunning collapse in U.S. business activity at the start of the second quarter as many service and production businesses remained closed. The Services PMI plunged 12.8 points to 27.0—a record low, while the Manufacturing PMI dropped 11.6 points to 36.9—its lowest level since March 2009. Both domestic and foreign demand plummeted reflecting the global nature of the pandemic. Furthermore, purchasing managers do not expect a recovery anytime soon–business sentiment regarding the outlook for the next 12 months slumped to a record low.
The Chicago Fed reported its National Activity Index (CFNAI) sank a record 4.25 points to -4.19 last month—its lowest reading since January of 2009. The index’s smoothed three-month average dropped 1.67 points to -1.47. The report noted both the CFNAI and its trend are consistent with a deep recession. Furthermore, the cyclical slowdown implies falling inflationary pressures. All four of the broad categories of indicators made negative contributions with production and employment declines faring the worst. Of the 85 individual indicators tracked by the CFNAI, 65 made negative contributions reflecting the very wide breadth of the contraction.
International Economic News: Canadian Prime Minister Justin Trudeau and Canada’s provincial premiers agreed to work toward a jointly-drafted set of national guidelines on reopening the economy this week. Federal and provincial sources say they hope to have a common set of guiding principles finalized by next week. “We ought to signal to Canadians there is a national standard, a national way of doing things, even if they are going to happen at different times,” a senior federal official said. “I think that there was broad consensus, as long as there is flexibility.” Several Canadian provinces are already taking steps to revive their economies. Saskatchewan and New Brunswick have released multi-step plans. Ontario and Quebec are poised to do the same next week.
One of the Bank of England’s top policymakers warned that the UK could be suffering its worst economic shock in several hundred years. Jan Vlieghe, a member of the BoE’s interest-rate setting committee, made this warning in a speech just released: “Based on the early indicators, and based on the experience in other countries that were hit somewhat earlier than the UK, it seems that we are experiencing an economic contraction that is faster and deeper than anything we have seen in the past century, or possibly several centuries.” Vlieghe says that the Covid‑19 virus, and the lockdown, has created both a supply shock (because people can’t work) and a demand shock (because normal consumption patterns have been destroyed by the lockdown).
French statistics agency INSEE reported the country-wide lockdown has reduced economic activity by more than 35% since it was first imposed. In an updated analysis of the economic impact of the coronavirus outbreak, INSEE said that in the private sector the loss of activity was as much as half of what it would be at normal levels. With the recovery likely to be gradual after the lockdown is lifted, INSEE said that the impact was likely to be bigger than its previous estimate that each month of lockdown would reduce GDP by three percentage points. The lockdown on non-essential activity is due to run until May 11, although the government has warned that not all businesses will be able to re-open at that time.
Germany’s private sector recession deepened in April as services and manufacturing suffered record falls in output due to the coronavirus outbreak and measures to contain it, research firm IHS reported. IHS Markit’s flash composite Purchasing Managers’ Index (PMI), which tracks the manufacturing and services sectors that together account for more than two-thirds of the economy, plunged to 17.1 from 35.0 the previous month. It was the lowest reading on record and far worse than earlier estimates of just a 4 point decline. IHS Markit economist Phil Smith said the April survey revealed the full effects of the pandemic and subsequent lockdown on Germany’s economy, with business activity across manufacturing and services falling at unprecedented rates. “Compared to a low of 36.3 during the financial crisis, the headline PMI’s reading of 17.1 paints a shocking picture of the pandemic’s impact on businesses,” Smith said.
Electricity generation and consumption in China both rebounded in the first half of April as measured by economists who turned to “alternative” indicators of economic activity to get a more accurate picture of the state of China’s economy than the government is portraying. Power generation climbed 1.2% in the first 15 days of April, compared to a 4.6% decline in March. Power consumption rose by 1.5% the first 10 days of the month, following a 4.2% decline in March. China’s electricity consumption has long been a closely-watched indicator since Premier Li Keqiang named it as one of three more trustworthy gauges of economic growth than official gross domestic product numbers, in a leaked conversation with a US official that took place in 2007.
Japan’s Cabinet Office used its most pessimistic language since the global financial crisis when it stated “The Japanese economy is getting worse rapidly in an extremely severe situation.” The Cabinet Office downgraded its view for the second straight month. In its latest report, it revised down its assessments of industrial output, private consumption and another four of the 11 main components. According to a report released by the International Monetary Fund, the Japanese economy, highly dependent on exports, is projected to contract by 5.2% in 2020, its worst downturn since 2009.
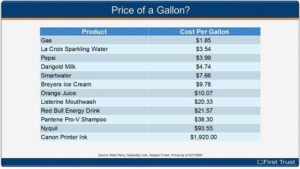
Finally: With the price of oil in the spotlight once again, it may surprise you that overall the price of gas, even when it was much higher than the current relatively low value, is still relatively cheap per gallon compared to several other consumer products. What’s the most expensive fluid that any consumer is likely to ever buy? Printer ink – and it’s not even close. No wonder they seem to practically give away the darn printers themselves! (Chart from First Trust)
(Sources: All index- and returns-data from Yahoo Finance; news from Reuters, Barron’s, Wall St. Journal, Bloomberg.com, ft.com, guggenheimpartners.com, zerohedge.com, ritholtz.com, markit.com, financialpost.com, Eurostat, Statistics Canada, Yahoo! Finance, stocksandnews.com, marketwatch.com, wantchinatimes.com, BBC, 361capital.com, pensionpartners.com, cnbc.com, FactSet.) Securities offered through Registered Representatives of Cambridge Investment Research Inc., a broker-dealer, member FINRA/SIPC. Advisory Services offered through Cambridge Investment Research Advisors, a Registered Investment Adviser. Strategic Investment Partners and Cambridge are not affiliated.
Indices mentioned are unmanaged and cannot be invested into directly. Past performance is no guarantee of future results.