
3-26-2018 Market Update
3-26-18 Market Update
The very big picture:
In the “decades” timeframe, the current Secular Bull Market could turn out to be among the shorter Secular Bull markets on record. This is because of the long-term valuation of the market which, after only eight years, has reached the upper end of its normal range.
The long-term valuation of the market is commonly measured by the Cyclically Adjusted Price to Earnings ratio, or “CAPE”, which smooths out shorter-term earnings swings in order to get a longer-term assessment of market valuation. A CAPE level of 30 is considered to be the upper end of the normal range, and the level at which further PE-ratio expansion comes to a halt (meaning that increases in market prices only occur in a general response to earnings increases, instead of rising “just because”).
Of course, a “mania” could come along and drive prices higher – much higher, even – and for some years to come. Manias occur when valuation no longer seems to matter, and caution is thrown completely to the wind as buyers rush in to buy first and ask questions later. Two manias in the last century – the 1920’s “Roaring Twenties” and the 1990’s “Tech Bubble” – show that the sky is the limit when common sense is overcome by a blind desire to buy. But, of course, the piper must be paid and the following decade or two are spent in Secular Bear Markets, giving most or all of the mania gains back.
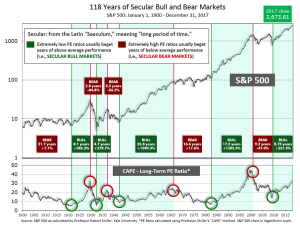
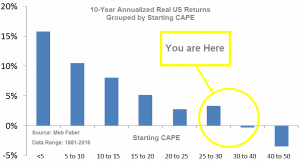
See Fig. 1 for the 100-year view of Secular Bulls and Bears. The CAPE is now at 31.68, down from the prior week’s 33.10, and still exceeds the level reached at the pre-crash high in October, 2007. This value is in the lower end of the “mania” range. Since 1881, the average annual return for all ten year periods that began with a CAPE around this level have been in the 0% – 3%/yr. range. (see Fig. 2).
In the big picture:
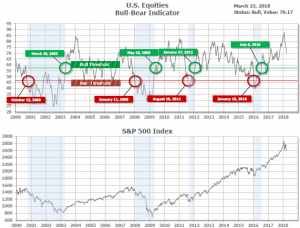
The “big picture” is the months-to-years timeframe – the timeframe in which Cyclical Bulls and Bears operate. The U.S. Bull-Bear Indicator (see Fig. 3) is in Cyclical Bull territory at 70.17, down from the prior week’s 73.95.
In the intermediate and Shorter-term picture:
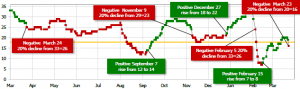
The Shorter-term (weeks to months) Indicator (see Fig. 4) turned negative on March 23rd. The indicator ended the week at 16, down from the prior week’s 20. Separately, the Intermediate-term Quarterly Trend Indicator – based on domestic and international stock trend status at the start of each quarter – was positive entering January, indicating positive prospects for equities in the first quarter of 2018.
Timeframe summary:
In the Secular (years to decades) timeframe (Figs. 1 & 2), the long-term valuation of the market is simply too high to sustain rip-roaring multi-year returns – but the market has entered the low end of the “mania” range, and all bets are off in a mania. The only thing certain in a mania is that it will end badly…someday. The Bull-Bear Indicator (months to years) is positive (Fig. 3), indicating a potential uptrend in the longer timeframe. In the intermediate timeframe, the Quarterly Trend Indicator (months to quarters) is positive for Q1, and the shorter (weeks to months) timeframe (Fig. 4) is negative. Therefore, with two indicators positive and one negative, the U.S. equity markets are rated as Neutral.
In the markets:
U.S. Markets: U.S. stocks suffered steep losses for the week as tensions grew over slowing global growth and a potential trade war. The large cap S&P 500 closed near its closing low from February’s sell-off and suffered its worst weekly loss since the beginning of 2016. The technology-heavy NASDAQ Composite fared even worse. For the week, the Dow Jones Industrial Average plunged 1,413 points, or -5.7%, to end the week at 23,533. The NASDAQ Composite fell a steeper -6.5%, losing the 7000-level and closing at 6,992. By market cap, smaller caps outperformed large caps with the S&P 500 large cap index giving up -6.0%, while the mid cap S&P 400 and small cap Russell 2000 gave up -5.0% and -4.8%, respectively.
International Markets: International markets were not immune to the selling as all major non-US markets finished in the red (though generally not as deeply in the red as the U.S). To the north, Canada’s TSX retreated -3.1%. In Europe, the United Kingdom’s FTSE 100 fell -3.4%. On Europe’s mainland, France’s CAC 40 ended down -3.6% while Germany’s DAX hit a new low for the year falling -4.0%. In Asia, China’s Shanghai Composite had its second down week giving up -3.6%, while Japan’s Nikkei also hit new lows for the year falling -4.9%. Hong Kong’s Hang Seng also finished down -3.8%. As grouped by Morgan Stanley Capital International, emerging markets retreated -4.7%, while developed markets gave up -3.6%.
Commodities: Precious metals and energy managed to finish the week in the green. Gold rallied 2.9% to end the week at $1349.90 an ounce, while Silver added 1.9% and ended the week at $16.58. Energy powered ahead for a third straight week with West Texas Intermediate crude oil gaining 5.6% to close at $65.88 per barrel. But copper, viewed by some analysts as an indicator of world economic health due to its variety of uses, slumped -3.7%.
U.S. Economic News: The number of people seeking new unemployment benefits rose by 3,000 to 229,000 last week but remained near their lowest levels since 1970. The reading modestly exceeded economists’ forecast of 225,000. The less-volatile monthly average of new claims increased slightly to 223,750. The Labor Department also reported the number of people already receiving unemployment benefits, so-called continuing claims, fell by 57,000 to 1.83 million. That number is at its lowest level since December of 1973. Overall, the employment picture in the U.S. hasn’t been this good in at least two decades and the biggest concern among employers continues to be difficulty finding skilled workers.
Sales of existing homes rebounded last month, rising 3% from January’s reading. The National Association of Realtors (NAR) reported existing-home sales ran at a seasonally-adjusted annual pace of 5.54 million in February. Year-over-year, sales were 1.1% higher than in February of 2017. At the current sales rate, there is a 3.4 month’s supply of homes available on the market, roughly half the amount considered to be a “healthy” housing market. Supply was 8.1% lower than the same time last year and homes spent an average of 37 days on the market. Sales were sharply mixed by region. In the Northeast, sales plunged 12.3%, while in the West sales surged 11.4%. Sales in the Midwest declined 2.4%, while in the South sales rose 6.6%. The median home price was $241,700 in February, up 5.9% from a year ago. NAR Chief Economist Lawrence Yun stated “housing demand remains solid” and told reporters he may upgrade his 2018 price forecasts.
New home sales fell for the third straight month in February according to the Commerce Department. New home sales dropped 0.6% to a seasonally-adjusted annual rate of 618,000 units last month. The median sales price in February was $326,800, nearly 10% higher than the same time last year. And while the government’s data on new-home construction and sales are often volatile and erratic overall, it’s clear that the trend continues to be up. Full-year 2017 new-home sales were up 9.4% compared to 2016. In addition, sales in the first two months of 2018 are 2.2% higher than the same period last year. At the current sales pace, there are roughly 5.9 months of supply of homes available on the market. A six-month supply of homes is generally considered to be a stable housing market.
The Commerce Department reported orders for goods expected to last longer than three years, so-called “durable goods”, jumped 3.1% in February, its largest gain since last summer. Business investment also rebounded in a good sign for the U.S. economy. Furthermore, core capital-goods orders, which strips out spending on defense and aircraft, also rose 1.8%. That reading ended a two-month losing streak and was its largest increase since early fall. In the details of the report, orders rose in every major category except for computers and telecommunications.
The Conference Board reported its index of Leading Economic Indicators (LEI) rose for its fifth consecutive month in February. The LEI rose 0.6% to 108.7, exceeding economists’ expectations of a 0.4% gain. The LEI is a composite of 10 economic metrics used to forecast the health of the U.S. economy. Last month, eight of the ten metrics advanced, with building permits and stock prices being the only negatives. Ataman Ozyildirim, director of business cycles and growth research at The Conference Board stated, “The LEI points to robust economic growth throughout 2018. Its six-month growth rate has not been this high since the first quarter of 2011.”
The Federal Reserve lifted its key U.S. interest rate this week but stuck with its forecast for just three rate hikes this year. As widely expected, the Fed raised its benchmark Federal-funds rate by a quarter point to between 1.5% and 1.75%–its sixth quarter-point move since December 2015. In the first meeting of the new Fed Chairman, Jerome Powell, the central bank avoided sending any overtly hawkish signal about its interest-rate policy. While sticking to its earlier forecast of three interest-rate hikes this year, the central bankers raised their expected rate path for 2019 and 2020. In its statement, the Fed said “the economic outlook has strengthened in recent months”, while adding that household and business fixed investment “have moderated from their strong fourth-quarter readings.” The Fed now sees a total of eight quarter-point hikes in the Fed-funds rate through the end of 2020.
International Economic News: The Conference Board of Canada reported that uncertainty around NAFTA talks and the possibility of increased U.S. duties will contribute to a significant slowdown in the Canadian economy after a “stellar 2017”. The Conference Board acknowledged that while household spending will remain the main economic driver, rising interest rates, rising household debt, and moderating employment growth will weigh on Canada’s growth. It added that exports and business investment are unlikely to pick up the slack. The Conference Board forecasts 2018 growth to come in at 1.9%, down from 3% last year. Matthew Stewart, the economic research and analysis group’s director of national forecasting stated that fears that NAFTA negotiations will fail has also weighed on business investment. President Trump had imposed 25% tariffs on imported steel and a 10% duty on U.S. aluminum imports but included exemptions for Canada and Mexico that could be rescinded if the negotiations fail.
The Bank of England maintained its benchmark interest rate at 0.5% this week but left the door open to an interest rate hike in May. While leaving its key interest rate unchanged, the bank said rate increases are likely this year. Minutes of the meeting showed that only two of the nine members on the Monetary Policy Committee backed an immediate quarter-point increase to 0.75%. The minutes indicated that while only those two wanted an interest rate hike now, the majority of the committee is ready to back another interest rate hike “soon.” As in February, the minutes showed that the “best collective judgment” of the rate-setting panel was that “an ongoing tightening of monetary policy over the forecast period would be appropriate to return inflation sustainably to its target at a more conventional horizon.”
Hundreds of thousands of French public sector workers marched across the country to protest against the government’s economic policies, including plans to reform public services and cut jobs. Workers from the national railway company SNCF were joined by employees of Air France and other public employees as they took to the streets of Paris and other major cities. The demonstrators are protesting President Emmanuel Macron’s plans to trim retirement benefits, overhaul unemployment insurance and allow SNCF’s competitors to enter the French market. However, opinion polls show a paradox. While a majority of voters back the strike, an even bigger majority support the reforms – including cutting the number of public sector workers and introducing merit-based pay.
In Germany, a panel of economic advisers raised their growth forecast for Europe’s economic powerhouse but warned that protectionist measures, both internally and externally, could damage the robust upswing. The panel of economists stated they expected gross domestic product to grow by 2.3% this year, up 0.1% from their previous forecast. In addition, the Munich-based Ifo Economic Institute was even more optimistic with its researchers reiterating their forecasts of 2.6% German growth this year. “Huge income tax reductions in the USA and the robust economic upturn in the euro zone are boosting demand for German goods and services,” Ifo said. But the advisors wared of external factors, specifically regarding Brexit and Italy’s election results, as well as planned U.S. import tariffs. Internally, German companies are facing increasing capacity constraints and labor shortages.
Chinese imports worth up to $60 billion will be subject to tariffs ordered by President Trump, moving the world’s two largest economies closer to a trade war. The move prompted the Chinese Commerce Ministry to respond stating, “China doesn’t hope to be in a trade war but is not afraid of engaging in one.” Trump is planning to impose the tariffs for what he states is a misappropriation of U.S. intellectual property. In a memorandum signed by Trump, there will be a 30-day consultation period that only starts once a list of Chinese goods is published. That creates time for potential talks to address Trump’s allegations on intellectual property theft and technology transfers forced on US companies as a condition for doing business in China.
Japanese consumer prices edged up 1% last month according to government data, however inflation was still far below the government long-standing target. While Japan has achieved eight consecutive quarters of economic growth, it has struggled to reach the 2.0% inflation target thought crucial to boost growth in the world’s third-largest economy. Stripping out fresh food and energy prices, inflation rose just 0.5%, the Economy Ministry stated. Japan has battled deflation for decades and the central bank’s ultra-loose monetary policy appears to be having a limited effect. The Bank of Japan has signaled no plans to alter its monetary policy despite moves in that direction by the world’s other major economies.
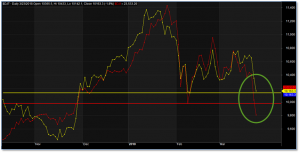
Finally: Financial analyst and journalist Mark Hulbert at MarketWatch.com penned a column this week stating that “it would take only a small stock market drop next week to trigger something big”. The market, it seems, is just barely above a “sell” signal from the famous “Dow Theory”. By some accounts, the Dow Theory has been a market-beater since the 1920’s, and has quite a few followers. If triggered, the sell signal could generate an excessive amount of selling. A Dow Theory sell signal is activated when both the Dow Jones Industrial Average and the Dow Jones Transportation Average fall short of reaching a previous high and then penetrate their recent lows on the next decline. As of Friday’s close, the Industrials closed below its trigger, while the Transports sit just 37 points above. In the chart below, the red line is the Dow Industrials, and the yellow line is the Dow Transports. Their respective trigger lines are the horizontal lines.
(sources: all index return data from Yahoo Finance; Reuters, Barron’s, Wall St Journal, Bloomberg.com, ft.com, guggenheimpartners.com, zerohedge.com, ritholtz.com, markit.com, financialpost.com, Eurostat, Statistics Canada, Yahoo! Finance, stocksandnews.com, marketwatch.com, wantchinatimes.com, BBC, 361capital.com, pensionpartners.com, cnbc.com, FactSet)
Indices mentioned are unmanaged and cannot be invested into directly. Past performance is no guarantee of future results. All Investing involves risk. Depending on the types of investments, there may be varying degrees of risk. Investors should be prepared to bear loss, including total loss of principal.