
3-6-2023 Weekly Market Update
The very Big Picture
The long-term valuation of the market is commonly measured by the Cyclically Adjusted Price to Earnings ratio, or “CAPE”, which smooths-out shorter-term earnings swings in order to get a longer-term assessment of market valuation. A CAPE level of 30 is considered to be the upper end of the normal range, and the level at which further PE-ratio expansion comes to a halt (meaning that further increases in market prices only occur as a general response to earnings increases, instead of rising “just because”). The market was recently above that level, and has fallen back.
Of course, a “mania” could come along and drive prices higher – much higher, even – and for some years to come. Manias occur when valuation no longer seems to matter, and caution is thrown completely to the wind – as buyers rush in to buy first, and ask questions later. Two manias in the last century – the “Roaring Twenties” of the 1920s, and the “Tech Bubble” of the late 1990s – show that the sky is the limit when common sense is overcome by a blind desire to buy. But, of course, the piper must be paid, and the following decade or two were spent in Secular Bear Markets, giving most or all of the mania-gains back.
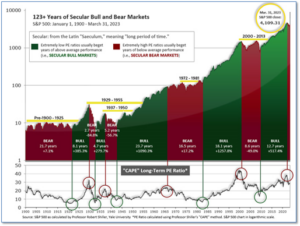
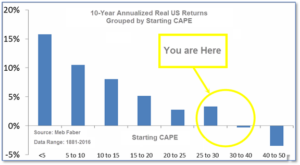
See Fig. 1 for the 100-year view of Secular Bulls and Bears. The CAPE is now at 29.38, up from the prior week’s 28.84. Since 1881, the average annual return for all ten-year periods that began with a CAPE in this range has been slightly positive to slightly negative (see Fig. 2).
Note: We do not use CAPE as an official input into our methods. However, if history is any guide – and history is typically ‘some’ kind of guide – it’s always good to simply know where we are on the historic continuum, where that may lead, and what sort of expectations one may wish to hold in order to craft an investment strategy that works in any market ‘season’ … whether the current one, or one that may be ‘coming soon’!
The Big Picture:
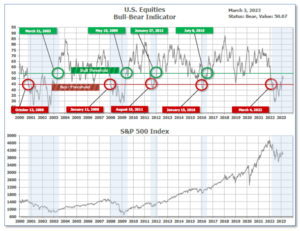
The ‘big picture’ is the (typically) years-long timeframe – the timeframe in which Cyclical Bulls and Bears operate. The U.S. Bull-Bear Indicator finished the week in Bear territory at 50.07, up from the prior week’s 49.57.
In the Quarterly- and Shorter-term Pictures
The Quarterly-Trend Indicator based on the combination of U.S. and International Equities trend-statuses at the start of each quarter – was Positive entering January, indicating positive prospects for equities in the first quarter of 2023.
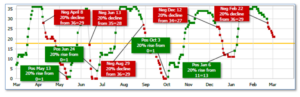
Next, the short-term(weeks to months) Indicator for US Equities turned negative on February 22, and ended the week at 21, down from the prior week’s 25.
In the Markets:
U.S. Markets: U.S. stocks closed higher and recovered some lost ground following their worst weekly decline in two months. Energy and materials shares were especially strong, while utilities lagged. The Dow Jones Industrial Average rebounded over 500 points to finish the week at 33,391—a gain of 1.7%. The technology heavy Nasdaq retraced 2.6% closing at 11,689. By market cap, the large cap S&P 500 gained 1.9%, the mid cap S&P 400 added 1.8% and the small cap Russell 2000 finished up 2.0%.
International Markets: International markets finished the week higher as well. Canada and the UK rose 1.8% and 0.9%, while Germany and France added 2.4% and 2.2% respectively. China’s Shanghai Composite rose for a second week, finishing up 1.9%, and Japan tacked on 1.7%. As grouped by Morgan Stanley Capital International, developed markets rose 2.7%. Emerging markets added 3.2%.
Commodities: Precious metals also moved to the upside. Gold rose 2.1% to $1854.60 per ounce, while Silver gained 1.4% to $21.24. The industrial metal copper, viewed by some analysts as a barometer of world economic health due to its wide variety of uses, finished the week up 2.9%. West Texas Intermediate crude oil added 4.4% to $79.68 per barrel.
February Summary: Major U.S. indexes finished the month of February in the red. The Dow fared the worst, giving up ‑4.2%, followed by large caps (-2.6%), mid caps (-2.0%) and small caps (-1.8%). The Nasdaq Composite finished the month down by -1.1%. February was a mixed month for international equity markets. Canada retreated -2.6%, but the UK added 1.3%. France and Germany rose 2.6% and 1.6%, respectively. China and Japan added 0.7% and 0.4% as well. As grouped by Morgan Stanley Capital International, developed markets finished down -3.1% and emerging markets had a particularly bad month, dropping -7.6% over the month. Commodities followed equities. Gold finished the month of February down -5.6%, silver retreated -11.6%, copper ended the month down -3.2% and oil dropped -2.3%.
U.S. Economic News: The number of Americans filing first time unemployment benefits fell slightly at the end of February, a sign of the labor market’s remarkable strength. New applications for unemployment benefits dropped to 190,000, holding below the 200,000-level for the seventh week in a row. Economists had expected claims would total 197,000. Thirty-four of the 53 U.S. states and territories that report jobless claims showed a decrease last week. Nineteen posted an increase. Meanwhile, the number of people already collecting unemployment benefits fell by 5,000 to 1.66 million. Josh Shapiro, chief economist at MFR Inc. wrote in a note that low jobless claims provide “evidence that, despite some well-publicized layoffs in tech and other sectors, and now some reports of reduced numbers of online job postings, most companies are either still hiring or are holding onto their employees and seeking other ways to cut costs.”
The number of home sale transactions in which a contract has been signed, but not yet closed, had their largest increase since June of 2020 in January, however with mortgage rates back up and applications for mortgages down analysts don’t expect it to last. The National Association of Realtors (NAR) reported its pending home sales index rose 8.1%, with sales rising for the second month in a row. The reading blew away analyst expectations of a 0.9% rise. Contract signings rose in all four regions on a monthly basis. Still, compared with the same time last year transactions were down 24.1%. Lawrence Yun, chief economist at NAR stated, “Home sales activity looks to be bottoming out in the first quarter of this year, before incremental improvements will occur.”
Home-price growth slowed at the end of last year as higher mortgage rates served as a headwind to potential buyers. S&P CoreLogic reported its Case-Shiller 20-city home price index pulled back 0.5% in December—its sixth consecutive monthly decline. On an annual basis, home prices were still up 4.6%, but down from the 6.8% annual increase in the previous month. A broader measure of home prices, the national index, fell a seasonally adjusted 0.3% in December, but was up 5.8% over the past year. Miami, Tampa and Atlanta reported the highest year-over-year gains among the 20 cities in December. San Francisco, Seattle and Portland reported the lowest.
For the vast services side of the U.S. economy (approximately 70%), a barometer of business conditions held steady at a robust level indicating the economy remains in expansion. The Institute for Supply Management reported its services index remained at 55.1 in February. Readings above 50 are a positive sign. Economists had expected the index to drop a point to 54. The biggest negative: High inflation was still a sore spot. In the details, the production gauge fell 4 points to 56.3, while new orders increased 2.2 points to 62.6. Employment remained strong as well, rising to a 14-month high of 54.
Orders for goods expected to last at least 3 years, so-called ‘durable goods’, pulled back in January but analysts say overall the report was strong. Orders for manufactured goods sank 4.5%, but that was predominantly due to a pullback in the volatile passenger-airplane segment. Setting transportation aside, new orders actually rose a solid 0.7%. Furthermore, business investment rose at its fastest pace in five months—another sign of strength for the economy early in the new year. Overall, U.S. manufacturers have recorded slower orders and are growing at a softer pace compared with last year, but they are still expanding. Oren Klachkin, lead U.S. economist at Oxford Economics noted that the report “adds to a recent string of data points that the economy continued to grow early in the first quarter.”
Confidence among the nation’s consumers fell to a three-month low over worries about a recession. The Conference Board reported its survey of consumer confidence slid 3.1 points to 102.9 in February, as high inflation and rising interest rates weighed on growth. Economists had forecast the index to rise to 108.5. In the report, the subindex that measures how consumers feel about the economy right now rose to a 10-month high of 152.8, while the gauge that looks ahead six months, fell to a seven-month low of 67.9. Of note, a reading below 80 often signals within the next year, the board said. Still, that particular index has hovered below that level for almost a year (save one month), and the economy has remained in expansion.
International Economic News: Statistics Canada reported the economy stagnated through the fourth quarter of last year, with a decline in December. Canada’s annualized fourth-quarter GDP flat lined, which ended a streak of five consecutive quarterly increases. Real GDP slowed in 2022 to 3.5% from 5% in 2021, after contracting 5.1% in 2020 during the pandemic restrictions. The data fell below the central Bank’s forecast for 1.3% annualized GDP growth through Q4. According to Robert Both, macro strategist at TD Securities, the fourth quarter figures offer “the BoC just a little bit of comfort that higher interest rates are working to slow demand, especially with the conflicting signals from the labor market over the last couple of months.” Through January, Canada added 10 times more jobs than anticipated and both manufacturing activity and retail sales picked up.
Across the Atlantic, analysts say Britain’s economy exceeds expectations, defying the Bank of England’s doom-laden predictions. The Bank of England’s chief economist, Huw Pill, admits Britain’s economy is ‘stronger than anticipated’ and that the private sector pay growth has leaned ‘slightly to the upside.’ Andrew Bailey, Governor of the Bank of England, counseled against ‘suggesting either that we are done with increasing the Bank Rate, or that we will inevitably need to do more.’ Pill acknowledged ‘tightness of the labor market and currently elevated level of inflation’ as potentially presenting a more positive picture, than the bank’s forecast that inflation would continue to plunge for subsequent months.
Sentiment worsened for German automakers amid demand concerns, according to a survey from Germany’s Ifo economic institute. Germany’s automotive industry dropped last month as concerns accumulated over falling demand. According to Oliver Falck, the director of the Ifo Center for Industrial Organization and New Technologies, “Manufacturers in particular assess their current situation as drastically worse than in the previous month. This presumably has to do with the fact that buyers are being very cautious at the moment.” The institute said its business situation index for the sector fell from 12.5 to 6.0 in January, while manufacturers’ outlook dropped from 21.4 points to 2.8 points this quarter. In contrast, suppliers rated their current situation as subsequently better than last month’s.
China’s manufacturing and services activity soared as a leading gauge of manufacturing hit a decade high last month. According to China’s National Bureau of Statistics, the purchasing managers’ index, climbed to 52.6 last month, surpassing estimates of 50.5. The Caixin China General Manufacturing PMI also climbed out of a six-month contraction and into expansion last month. According to Wang Zhe, a senior economist at Caixin, “The economy has entered a post-epidemic recovery era.” A senior expert with the statistics bureau, Zhao Qinghe, said that out of 21 manufacturing areas surveyed, “all were booming.” Zhao added that, “key industries are continuing to rise,” especially in food, processing, textiles and automobiles.
Japan’s economy has diverged into weak manufacturing and robust service-sector activity. Factory output saw its fastest drop in eight months at the beginning of this quarter. Its contraction of 4.6% surpassed economists’ initial median forecast of 2.6%. Declining overseas demand hurt industries such as auto and semiconductor equipment, but retail sales posted their fastest growth since 2021. Kazuo Ueda, the upcoming governor for the Bank of Japan, emphasized the need to maintain the current low interest rates to support the delicate economy.
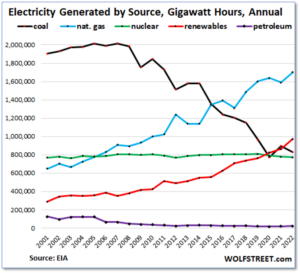
Finally: The mix of electric-generation sources has changed dramatically in recent years in the U.S. Last year was a milestone year in which “renewables” (wind, solar, geothermal, biomass and hydro) have convincingly pulled ahead of coal to take the #2 position among sources. What’s #1 and also rising strongly? Natural gas is #1, and has reached new consumption highs in 4 of the last 5 years. The future can’t be known with certainty, but it is no doubt true that coal’s heyday as a dominant source of electric generation is long past. (Chart from wolfstreet.com)
(Sources: All index- and returns-data from Yahoo Finance; news from Reuters, Barron’s, Wall St. Journal, Bloomberg.com, ft.com, guggenheimpartners.com, zerohedge.com, ritholtz.com, markit.com, financialpost.com, Eurostat, Statistics Canada, Yahoo! Finance, stocksandnews.com, marketwatch.com, wantchinatimes.com, BBC, 361capital.com, pensionpartners.com, cnbc.com, FactSet.) Content provided by WE Sherman and Company. Securities offered through Registered Representatives of Cambridge Investment Research Inc., a broker-dealer, member FINRA/SIPC. Advisory Services offered through Cambridge Investment Research Advisors, a Registered Investment Adviser. Strategic Investment Partners and Cambridge are not affiliated. Indices mentioned are unmanaged and cannot be invested into directly. Past performance is no guarantee of future results. These opinions of Strategic Investment Partners and not necessarily those of Cambridge Investment Research, are for informational purposes only and should not be construed or acted upon as individualized investment advice.