3-13-2023 Weekly Market Update
The very Big Picture
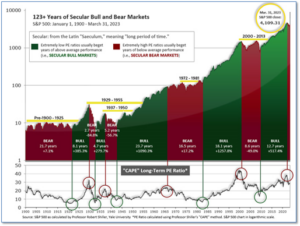
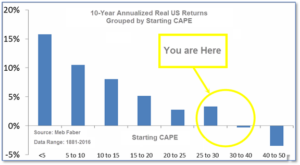
The long-term valuation of the market is commonly measured by the Cyclically Adjusted Price to Earnings ratio, or “CAPE”, which smooths-out shorter-term earnings swings in order to get a longer-term assessment of market valuation. A CAPE level of 30 is considered to be the upper end of the normal range, and the level at which further PE-ratio expansion comes to a halt (meaning that further increases in market prices only occur as a general response to earnings increases, instead of rising “just because”). The market was recently above that level, and has fallen back.
Of course, a “mania” could come along and drive prices higher – much higher, even – and for some years to come. Manias occur when valuation no longer seems to matter, and caution is thrown completely to the wind – as buyers rush in to buy first, and ask questions later. Two manias in the last century – the “Roaring Twenties” of the 1920s, and the “Tech Bubble” of the late 1990s – show that the sky is the limit when common sense is overcome by a blind desire to buy. But, of course, the piper must be paid, and the following decade or two were spent in Secular Bear Markets, giving most or all of the mania-gains back.

See Fig. 1 for the 100-year view of Secular Bulls and Bears. The CAPE is now at 28.05, down from the prior week’s 29.38. Since 1881, the average annual return for all ten-year periods that began with a CAPE in this range has been slightly positive to slightly negative (see Fig. 2).

Note: We do not use CAPE as an official input into our methods. However, if history is any guide – and history is typically ‘some’ kind of guide – it’s always good to simply know where we are on the historic continuum, where that may lead, and what sort of expectations one may wish to hold in order to craft an investment strategy that works in any market ‘season’ … whether the current one, or one that may be ‘coming soon’!
The Big Picture
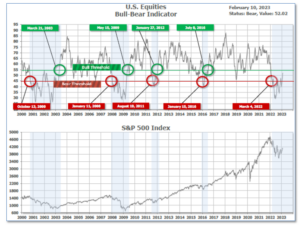
The ‘big picture’ is the (typically) years-long timeframe – the timeframe in which Cyclical Bulls and Bears operate. The U.S. Bull-Bear Indicator finished the week in Bear territory at 47.79, down from the prior week’s 50.07.

In the Quarterly- and Shorter-term Pictures
The Quarterly-Trend Indicator based on the combination of U.S. and International Equities trend-statuses at the start of each quarter – was Positive entering January, indicating positive prospects for equities in the first quarter of 2023.
Next, the short-term(weeks to months) Indicator for US Equities turned negative on February 22, and ended the week at 14, down from the prior week’s 21.

In the Markets:
U.S. Markets: U.S. stocks pulled back sharply over the week, after Federal Reserve Chair Jerome Powell told congressional committees that he and his fellow policymakers still had work to do in cooling inflation and the hot labor market. The benchmark S&P 500 Index fell on Friday to its lowest intraday level since January 5. The Dow Jones Industrial Average retreated almost 1500 points to 31,910, a decline of -4.4%. The technology-heavy NASDAQ Composite retreated -4.7%. By market cap, the large cap S&P 500 ended down -4.5%, mid-caps plunged -7.4% and the small cap Russell 2000 collapsed -8.1%.
International Markets: International equity markets didn’t fare much better. Every single major market finished in the red as well, save Japan. Canada’s TSX pulled back -3.9% along with the UK’s FTSE 100 which retreated -2.5%. France’s CAC 40 and Germany’s DAX declined -1.7% and -1.0%, respectively. In Asia, China’s Shanghai Composite ended down -3%. Japan’s Nikkei managed a 0.8% rise. As grouped by Morgan Stanley Capital International, developed markets declined -3.1% while emerging markets retreated -4.3%.
Commodities: Precious metals ended the week mixed. Gold rose 0.7% to $1867.20 per ounce, while Silver declined ‑3.5% to $20.51. Energy pulled back as well. West Texas Intermediate crude oil gave up most of last week’s gains, declining -3.8% to $76.68 per barrel. The industrial metal copper, viewed by some analysts as a barometer of world economic health due to its wide variety of uses, finished the week down -0.9%.
U.S. Economic News: The number of Americans filing initial jobless claims jumped to a 10-week high last week, but analysts noted the increase was primarily due to the states of New York and California. The Labor Department reported initial jobless claims rose to 211,000, up 21,000 from the prior week. It’s the first time in eight weeks claims have topped the 200,000-mark. Economists had expected claims to total 195,000. Thirty-seven of the 53 U.S. states and territories that report jobless claims showed an increase last week. Seventeen posted a decline. Most states aside from New York and California reported little change. Meanwhile, the number of people collecting unemployment benefits rose by 69,000 to a two-month high of 1.72 million. That number is reported with a one-week lag.
The U.S. created a robust 311,000 new jobs last month, keeping pressure on the Federal Reserve to raise rates to tame high inflation. Economists had expected only 225,000 new jobs to be created. Half of the new jobs created last month were at service-side companies such as retailers (50,000), restaurants (70,000) and hotels (14,000) — businesses whose employment still has not returned to pre-pandemic peaks. Government (46,000), white-collar professional businesses (45,000), health-care providers (44,000) and construction companies (24,000) accounted for the rest of the increase in hiring in February. The unemployment rate rose a few ticks to 3.6%, while hourly wages rose just 0.2% to mark its smallest increase in a year.
The number of job openings in the U.S. fell in January to 10.8 million, but the still-high number of available jobs suggested the labor market remained extremely strong. The number of job openings is seen as a cue to the health of the labor market and the broader U.S. economy. Last year they hit a record of 12 million. The Fed wants to see a big decline in job openings, however, to help loosen up a tight labor market and ease the upward pressure on wages as it battles high inflation. The tight labor market threatens to keep wage growth high and make it harder for the Fed to tame rampant price increases.
In testimony in front of the Senate Banking Committee, Federal Reserve Chairman Jerome Powell pledged to continue the battle against inflation, arguing that the U.S. economy “does not work for anyone” without stable prices. Over the past two policy meetings, the Fed has slowed the pace of its interest rate increases from a 75 basis point hike in November to only 25 basis points in early February. Powell left the door open for accelerating the pace of monetary tightening again if necessary. “If the totality of the data were to indicate that faster tightening is warranted, we would be prepared to increase the pace of rate hikes,” Powell said.
The Federal Reserve’s “Beige Book”, a collection of anecdotal reports from each of its member banks, showed half of the Fed’s 12 districts reported little or no growth through the end of last month. The other six districts indicated growth expanded at a modest pace, the report said. As a result, nationwide activity increased only slightly, the Fed report concluded. That fits with the forecast of a slight 0.4% decline in first quarter GDP from S&P Global Market Intelligence, a leading forecasting firm. According to the latest report, inflation pressures remained widespread. Underneath this headline, conditions were mixed. Many districts reported a moderation in price increases. Energy and raw material prices were reported to be rising, although there was relief in shipping and freight costs.
International Economic News: Canadians’ wage growth surpassed an annualized 5% in February, Statistics Canada reported this week. The Labour Force Survey showed average hourly wage increases hit 5.4% annually at $33.16 last month. Wage growth is one facet of the economy closely monitored by the BoC as it aims to reel in inflation to its target 2%. The BoC expects weak economic growth for subsequent quarters to “moderate wage growth” and ease pressures in the labour market. CIBC economists Benjamin Tal and Karyne Charbonneau noted that job growth in high-paying industries outpaced growth in low-paying sectors. “The Canadian labour market is tight, but the headline figures overstate its strength,” they said. Royce Mendes, head of macro strategy at Desjardins, said the strong labour market veers the BoC off course from its initial plan and could potentially force the central bank to alter its decision to pause interest rate increases. “We’re seeing wage growth pick up to levels that are going to make the Bank of Canada uncomfortable,” Mendes stated. “I worry that this is setting up the possibility for further rate hikes this year,” he added.
Across the Atlantic, while Britain’s GDP print shows strength, economists project a downward trajectory for activity as high inflation weighs on household incomes. According to Tom Hopkins, portfolio manager at BRI Wealth Management, monthly figures are difficult to read, given distortions over the last six months — such as the funeral of Queen Elizabeth II and the World Cup — which partially affected consumer services. Suren Thiru, economics director at the Institute of Chartered Accountants in England and Wales, stated, “We’re likely to continue flirting with recession throughout much of 2023, as high inflation, tax increases and the lagged effect of rising interest rates shrinks consumer spending power, despite a boost from easing energy costs.”
On Europe’s mainland, the French economy will grow more than 0.3% in 2023, France’s central bank chief Francois Villeroy de Galhau announced. The Bank of France stated that the French economy would grow approximately 0.1% through the first quarter of this year. Meanwhile, Emmanuel Macron spoke publicly twice in response to continuous protests against the proposed pension reform this week. The Elysée Palace forwarded a letter from the president to the eight unions and five youth organizations that had written to him regarding the “lack of response” of the president and his administration. “As always, the government is listening to you in moving forward with negotiation,” the French President conceded.
Germany experienced a significant increase in industrial production at the start of the quarter. According to its federal statistical office, Germany’s industrial production increased by 3.5% from the previous month, surpassing analysts’ 1.4% expectations for January. The ameliorating development “was driven in particular by strong growth in the manufacturing of electronic equipment and chemicals,” the statistics office stated. On the other hand, motor vehicle manufacturing and pharmaceutical products manufacturing, remained weak. The statistical office further noted that German retail sales fell unexpectedly through January by 0.3% compared to December.
In China, the former Communist Party chief of Shanghai, Li Qiang, took office as China’s premier. Weak confidence among consumers and the private sector present a daunting task for China’s premier. As tensions rise with the West, global companies have diversified their supply chains with other manufacturing nations due to political risks. Earlier this quarter, Beijing set its 2023 growth target around 5%, its lowest goal in nearly three decades. Li’s primary task this year will be seizing that target without triggering serious inflation or piling on debt, said Christopher Beddor, deputy China research director at Gavekal Dragonomics. “The leadership has already accepted two years of exceptionally weak economic growth in the name of COVID containment. Now that containment is gone, they won’t accept another,” Beddor said.
Japan’s GDP grew 0.1% annually in the fourth quarter, according to revised figures from the Cabinet Office. However, the slight increase was seen as a disappointment as initial estimates and economist forecasts had projected significantly higher figures. The data suggested the latest wave of Covid, and rising food prices, hindered consumer activity. The perpetual weakness in the economy reinforces the central bank’s perspective that Japan still needs assistance from easy monetary policy. Economist Kazuo Ueda will take over from Kuroda on April 9 as the first academic to lead the central bank. With prices accelerating at its fastest pace in four decades, Ueda is tasked with navigating a gradual shift towards normalizing interest rates, after Japan’s two decades of experimentation with quantitative easing measures.
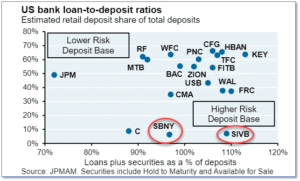
Finally: The question everyone asked since last Thursday (3/9/23) has been “Why did Silicon Valley Bank go bust? And what does it mean for MY bank?” The best explanation is that Silicon Valley Bank (SIVB) was uniquely at risk because of its unusually low percent of individual depositors, and its unusually high portfolio of loans and securities backing up their deposits. How “unusual”? The following chart, from JP Morgan Asset Management shows that Silicon Valley Bank was indeed in a class of its own – a deadly combination of the lowest % of retail depositors and the highest percent of loans and securities backing up their deposits among all similarly-sized banks in the country. Oh, and one more thing: the SECOND-worst bank by these measurements, SBNY, was suddenly forced into receivership by regulators on Sunday 3/12/23. (Chart from JP Morgan Asset Management).

(Sources: All index- and returns-data from Yahoo Finance; news from Reuters, Barron’s, Wall St. Journal, Bloomberg.com, ft.com, guggenheimpartners.com, zerohedge.com, ritholtz.com, markit.com, financialpost.com, Eurostat, Statistics Canada, Yahoo! Finance, stocksandnews.com, marketwatch.com, wantchinatimes.com, BBC, 361capital.com, pensionpartners.com, cnbc.com, FactSet.) Content provided by WE Sherman and Company. Securities offered through Registered Representatives of Cambridge Investment Research Inc., a broker-dealer, member FINRA/SIPC. Advisory Services offered through Cambridge Investment Research Advisors, a Registered Investment Adviser. Strategic Investment Partners and Cambridge are not affiliated. Indices mentioned are unmanaged and cannot be invested into directly. Past performance is no guarantee of future results. These opinions of Strategic Investment Partners and not necessarily those of Cambridge Investment Research, are for informational purposes only and should not be construed or acted upon as individualized investment advice.
