
2-27-2023 Weekly Market Update
The very Big Picture
The long-term valuation of the market is commonly measured by the Cyclically Adjusted Price to Earnings ratio, or “CAPE”, which smooths-out shorter-term earnings swings in order to get a longer-term assessment of market valuation. A CAPE level of 30 is considered to be the upper end of the normal range, and the level at which further PE-ratio expansion comes to a halt (meaning that further increases in market prices only occur as a general response to earnings increases, instead of rising “just because”). The market was recently above that level, and has fallen back.
Of course, a “mania” could come along and drive prices higher – much higher, even – and for some years to come. Manias occur when valuation no longer seems to matter, and caution is thrown completely to the wind – as buyers rush in to buy first, and ask questions later. Two manias in the last century – the “Roaring Twenties” of the 1920s, and the “Tech Bubble” of the late 1990s – show that the sky is the limit when common sense is overcome by a blind desire to buy. But, of course, the piper must be paid, and the following decade or two were spent in Secular Bear Markets, giving most or all of the mania-gains back.
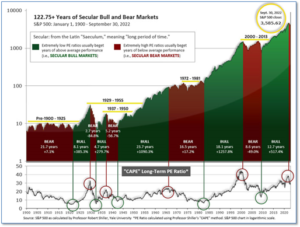
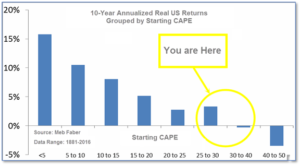
See Fig. 1 for the 100-year view of Secular Bulls and Bears. The CAPE is now at 28.84, down from the prior week’s 29.63. Since 1881, the average annual return for all ten-year periods that began with a CAPE in this range has been slightly positive to slightly negative (see Fig. 2).
Note: We do not use CAPE as an official input into our methods. However, if history is any guide – and history is typically ‘some’ kind of guide – it’s always good to simply know where we are on the historic continuum, where that may lead, and what sort of expectations one may wish to hold in order to craft an investment strategy that works in any market ‘season’ … whether the current one, or one that may be ‘coming soon’!
The Big Picture:
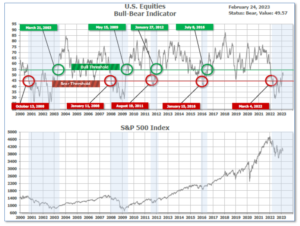
The ‘big picture’ is the (typically) years-long timeframe – the timeframe in which Cyclical Bulls and Bears operate. The U.S. Bull-Bear Indicator finished the week in Bear territory at 49.57, down from the prior week’s 52.13.
In the Quarterly- and Shorter-term Pictures
The Quarterly-Trend Indicator based on the combination of U.S. and International Equities trend-statuses at the start of each quarter – was Positive entering January, indicating positive prospects for equities in the first quarter of 2023.
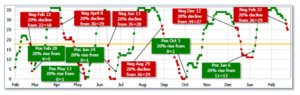
Next, the short-term(weeks to months) Indicator for US Equities turned negative on February 22, and ended the week at 25, down from the prior week’s 31.
In the Markets:
U.S. Markets: U.S. equity markets suffered their biggest decline in over two months as inflation remained entrenched and positive growth numbers meant the Federal Reserve still had work to do. At its close Friday, the S&P 500 index had surrendered roughly a third of the rally that began in October, but remained up 3.4% for the year to date. The Dow Jones Industrial Average shed over 1000 points ending the week at 32,817—a decline of 3.0%. The technology-heavy NASDAQ Composite fared the worst of the major indexes retreating -3.3%. By market cap, the large cap S&P 500 pulled back -2.7%, the mid cap S&P 400 fell -2.5% and small caps finished the week down -2.9%.
International Markets: Most of the major international markets finished the week in the red as well. Canada’s TSX and the UK’s FTSE fell -1.4% and -1.6% respectively, while France’s CAC declined -2.2%. Germany ended the week down -1.8%. China’s Shanghai Composite managed a 1.3% rise, while Japan’s Nikkei ticked down -0.2%. As grouped by Morgan Stanley Capital International, developed markets retreated -2.8%. Emerging markets declined -3.5%.
Commodities: Precious metals went along with equities and ended the week down as well. Gold declined -1.8% to $1817.10, while Silver fell -3.6% to $20.94. West Texas Intermediate crude fell a slight -0.3% to $76.32 per barrel. The industrial metal copper, viewed by some analysts as a barometer of global economic health due to its wide variety of uses, finished the week down -3.8%.
U.S. Economic News: The U.S. labor market remained extremely tight as the number of Americans filing for first-time unemployment benefits held below key levels. The Labor Department reported initial jobless claims fell by 3,000 to 192,000 in the week ending February 18. Economists had expected new claims would rise by 3,000 to 197,000. It was the sixth consecutive week below 200,000—a signal of a strong labor market. Meanwhile, the number of people already collecting jobless benefits fell by 37,000 to 1.65 million. Nancy Vanden Houten, lead U.S. economist at Oxford Economics expects the labor market to soften, but not as severely as in prior recessions. “We expect jobless claims to trend higher as the economy slows in response and eventually enters a mild recession later this year. But the rise may be muted compared to prior recessions as employers will be reluctant to lay off workers that have been difficult to find in the first place,” she wrote.
Sales of existing homes fell for the 12th consecutive month, hitting the lowest level since 2010. The National Association of Realtors (NAR) reported existing-home sales fell 0.7% to a seasonally-adjusted annual rate of 4 million in January. Economists had expected a fall to 4.2 million. The 12-month losing streak is the longest since the NAR began tracking sales in 1999. Compared with the same time in 2021, home sales were down 36.9%. Still, despite the weakness the median price for a new home rose 1.3% to $359,000. In terms of supply, the NAR reports there is a 2.9-month supply of homes available for sale on the market. Before the pandemic, a six-month supply of homes was generally considered a “balanced” housing market. Sales of existing homes were mixed across the country, falling in the Northeast and Midwest, but rising in the South and the West.
The economy grew at the slower pace of an annualized 2.7% at the end last year as consumers cut back on their spending. The result was down from an initial reading of 2.9% annual growth. Consumer spending, the main engine of the economy, grew at a 1.4% annual clip, rather than 2.1% as originally reported. That mostly explained the drop in GDP growth. Early economic data indicate the U.S. is on track to expand at a far slower pace or even to contract. Rising interest rates and high inflation have forced consumers and businesses to trim spending and investment, most notably in interest-sensitive sectors such as housing and construction.
The cost of goods and services jumped by 0.6% at the beginning of the year, its biggest increase since last summer, in another sign that stubbornly high inflation is likely to remain for the foreseeable future. The rate of inflation, as measured by the Federal Reserve’s “preferred” inflation gauge—the Personal Consumption Expenditures (PCE) index, had tapered off rapidly since last summer. The annual increase in prices rose to 5.4% from 5.3% in December, the first uptick in seven months. The PCE had hit a 40-year high of 7% last June. The more closely followed core index also rose 0.6% last month. Analysts had forecast a 0.5% gain. The increase in the core rate of inflation in the past 12 months moved up 4.7% from 4.6.%. Unlike CPI, the PCE gauge takes into account how consumers change their buying habits due to rising prices.
The U.S. economy showed signs of a rebound last month according to a pair of surveys from S&P Global. S&P’s preliminary “flash” reading of the vast U.S. services sector climbed 3.7 points to 50.5—its first positive (i.e., >50) reading since last summer, while the manufacturing sector ticked up to a four-month high of 47.8 from 46.9. S&P Global surveys are among the first indicators each month to assess the health of the economy. In the details, new orders (a harbinger of future activity) improved, but remained soft. Businesses still report concerns over the tight labor market and rising wages. Chris Williamson, chief business economist at S&P Global stated, “February is seeing a welcome steadying of business activity after seven months of decline. The business mood has brightened amid signs that inflation has peaked and recession risks have faded.”
Minutes from the Federal Reserve’s meeting in early February showed that some officials were worried about the then-recent easing in financial conditions. Ahead of the January 31-February 1 meeting, stocks had been rallying and bond yields had slipped after three months of good news on the inflation front. According to the minutes, a “number” of Fed officials noted that financial conditions had eased, “which some noted could necessitate a tighter stance of monetary policy,” the minutes showed. Overall, the minutes show that all Fed officials were supporting further increases in the interest rates. There were signs of some divisions emerging. “Several” Fed officials thought the risks to the economic outlook “were becoming more balanced,” suggesting high inflation was not the single focus. Notably, the Fed staff forecast still expects real GDP growth “to slow markedly this year and the labor market to soften.”
International Economic News: The Bank of Canada took a “big step in the right direction,” economists say. Statistics Canada recorded price slowdowns in numerous categories including vehicles sales and housing replacement costs, based upon falling home prices. Meanwhile prices for groceries saw an annual increase to10.4% from December’s 10.1%. RBC economist Claire Fan said, “Lower agricultural commodity prices and easing global supply chain pressures are expected to slow food price growth this year.” January’s inflation slowdown may reinforce the Bank of Canada’s conditional pledge to pause rate hikes. “Overall, this milder report will provide the BoC with some comfort on their decision to move to a conditional pause,” said Douglas Porter, chief economist at Bank of Montreal.
Across the Atlantic, interactions with major businesses signify greater resilience in the UK economy, said Schroders fund manager Andy Brough. The Bank of England forecasts a five quarter recession as high energy prices and rising interest rates constrict consumer spending. Lloyds Bank, the latest in a string of major U.K. businesses to report strong fourth-quarter earnings and boost capital returns, announced a £2 billion ($2.42 billion) share buyback and increased its final dividend to 1.6 pence per share. Andy Brough, head of the pan-European small and mid-cap team at British asset manager Schroders, said that his interactions with UK businesses suggest consumers are still shopping and spending. “There’s seven wonders of the world, and the eighth wonder of the world is how GDP is calculated,” he said.
On Europe’s mainland, economic activity in France will likely be stronger than expected through the first quarter in 2023. While high energy and food prices remain a valid concern for French consumers, the climate for French business shows overall improvement. The services and retail sectors, alongside the industrial sector, reported growth through February. According to the INSEE survey, French companies expect activity to rise in the services sector. The dynamism of activity in services, with traded services accounting for 57% of French value-added, can counterbalance the deterioration in the manufacturing sector (9% of total value-added). Unlike other European countries, France has not hit its inflationary peak and prices are expected to continue rising in subsequent quarters.
Germany, Europe’s largest economy, contracted 0.4% in the final quarter of 2022, according to the German Statistical office. Net exports, government consumption and a large inventory build-up kept the economy from slipping into a steeper contraction, but the fall in private consumption and capital investments shows that celebrating resilience was a bit premature. A second consecutive drop in the Ifo’s current assessment component, a fall in PMI manufacturing, and a decrease in consumer confidence lead economists to believe the trend will continue. Sentiment indicators increased over the last few months, as fiscal support and warm winter weather have supported the German economy, but a strong rebound isn’t expected anytime soon.
The United States will resume economic conversations with China “at an appropriate time,” U.S. Treasury Secretary Janet Yellen said. The Treasury Secretary described a meeting on economic policy with the Vice Premier of the People’s Republic of China, Liu He, as “constructive.” Good communication between the U.S. and China is vital for the macroeconomic and financial situations domestically and within the global economy, Yellen added. Chinese President Xi Jinping and Russian President Vladimir Putin are expected to meet this spring as Russia deepens its ties with China. China continued selling its stock of Treasury bonds as the U.S. warns against possible sanctions violations in relation to Russia.
The Bank of Japan (BOJ) maintained its ultra-loose monetary policy even though inflation exceeded its 2% target. Kazuo Ueda, nominee for governor of the Bank of Japan, said the recent rise in consumer inflation was primarily driven by surging import costs for raw materials, rather than strong domestic demand. As inflation exceeds the BOJ’s 2% target, Ueda is tasked with phasing out “Yield Curve Control” (YCC). Under YCC, the central bank guides short-term interest rates at -0.1% and the 10-year bond yield around 0% to (attempt to) sustainably achieve its 2% inflation target. YCC has drawn public criticism for distorting market functions and crushing banks’ margins. “It’s standard practice to act pre-emptively to demand-driven inflation, but not respond immediately to supply-driven inflation. Otherwise, the BOJ will be cooling demand, worsening the economy and pushing down prices by tightening monetary policy,” Ueda said.
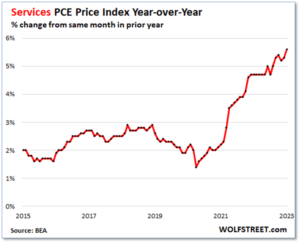
Finally: The Fed’s “preferred” inflation gauge (Personal Consumption Expenditures, or PCE) not only came in worse than expected, but the prior three months were all revised higher as well. “The whole thing throws a lot of cold water on the ‘disinflation’ hoopla,” observed Wolf Richter of wolfstreet.com. Even worse, on a year-over-year basis, the PCE Price Index for services spiked by 5.6%–the worst since 1984. Services is where inflation is running hot, and services makes up almost two-thirds of consumer spending. (Chart from Wolfstreet.com)
(Sources: All index- and returns-data from Yahoo Finance; news from Reuters, Barron’s, Wall St. Journal, Bloomberg.com, ft.com, guggenheimpartners.com, zerohedge.com, ritholtz.com, markit.com, financialpost.com, Eurostat, Statistics Canada, Yahoo! Finance, stocksandnews.com, marketwatch.com, wantchinatimes.com, BBC, 361capital.com, pensionpartners.com, cnbc.com, FactSet.) Content provided by WE Sherman and Company. Securities offered through Registered Representatives of Cambridge Investment Research Inc., a broker-dealer, member FINRA/SIPC. Advisory Services offered through Cambridge Investment Research Advisors, a Registered Investment Adviser. Strategic Investment Partners and Cambridge are not affiliated. Indices mentioned are unmanaged and cannot be invested into directly. Past performance is no guarantee of future results. These opinions of Strategic Investment Partners and not necessarily those of Cambridge Investment Research, are for informational purposes only and should not be construed or acted upon as individualized investment advice.