
3-4-19 Weekly Market Update
The very big picture:
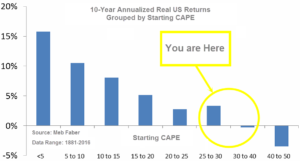
The long-term valuation of the market is commonly measured by the Cyclically Adjusted Price to Earnings ratio, or “CAPE”, which smooths out shorter-term earnings swings in order to get a longer-term assessment of market valuation. A CAPE level of 30 is considered to be the upper end of the normal range, and the level at which further PE-ratio expansion comes to a halt (meaning that increases in market prices only occur in a general response to earnings increases, instead of rising “just because”). The market is currently at that level.
Of course, a “mania” could come along and drive prices higher – much higher, even – and for some years to come. Manias occur when valuation no longer seems to matter, and caution is thrown completely to the wind as buyers rush in to buy first and ask questions later. Two manias in the last century – the 1920’s “Roaring Twenties” and the 1990’s “Tech Bubble” – show that the sky is the limit when common sense is overcome by a blind desire to buy. But, of course, the piper must be paid and the following decade or two are spent in Secular Bear Markets, giving most or all of the mania gains back.

See Fig. 1 for the 100-year view of Secular Bulls and Bears. The CAPE is now at 30.63, up from the prior week’s 30.56, about the level reached at the pre-crash high in October, 2007. Since 1881, the average annual return for all ten year periods that began with a CAPE around this level have been in the 0% – 3%/yr. range. (see Fig. 2).
In the big picture:
The “big picture” is the months-to-years timeframe – the timeframe in which Cyclical Bulls and Bears operate. The U.S. Bull-Bear Indicator (see Fig. 3) is in Cyclical Bull territory at 64.43, up from the prior week’s 62.08.

In the intermediate and Shorter-term picture:
The Shorter-term (weeks to months) Indicator (see Fig. 4) turned positive on November 28th. The indicator ended the week at 36, unchanged from the prior week. Separately, the Intermediate-term Quarterly Trend Indicator – based on domestic and international stock trend status at the start of each quarter – was negative entering January, indicating negative prospects for equities in the first quarter of 2019.

Timeframe summary:
In the Secular (years to decades) timeframe (Figs. 1 & 2), the long-term valuation of the market is historically too high to sustain rip-roaring multi-year returns. The Bull-Bear Indicator (months to years) remains positive (Fig. 3), indicating a potential uptrend in the longer timeframe. In the intermediate timeframe, the Quarterly Trend Indicator (months to quarters) is negative for Q1, and the shorter (weeks to months) timeframe (Fig. 4) is positive. Therefore, with two indicators positive and one negative, the U.S. equity markets are rated as Neutral.
In the markets:
U.S. Markets: The major U.S. market indexes finished the week in mixed fashion, with the technology-heavy NASDAQ Composite performing the best while smaller-cap benchmarks lagged. The Dow Jones Industrial Average was essentially unchanged declining just 5 points to 26,026 while the NASDAQ gained 0.9% finishing the week at 7,595. By market cap, the large cap S&P 500 rose 0.4%, while the mid cap S&P 400 declined -0.4%, and the small cap Russell 2000 finished the week essentially flat.
International Markets: International markets were mixed on the week. Canada’s TSX rose 0.3% while the United Kingdom’s FTSE finished down -1%. On Europe’s mainland France’s CAC 40 added 0.9%, Germany’s DAX finished up 1.3%, and Italy’s Milan FTSE rose 2.1%. In Asia, China’s Shanghai Composite surged 6.8%, while Japan’s Nikkei gained 0.8%. As grouped by Morgan Stanley Capital International, developed markets added 0.8% while emerging markets finished down -1.3%.
Commodities: Following two weeks of gains, Gold ended the week down -2.5% (-$33.60) to $1299.20 an ounce. Silver finished the week down a steeper -4.1% to $15.26 an ounce. Crude oil also retreated after two weeks of gains, giving up -2.6% to $55.80 per barrel for West Texas Intermediate crude. Copper, seen as an indicator of global economic health due its variety of industrial uses, retreated -0.7%.
February Summary: Major markets around the world were positive in February. The Dow Jones Industrial Average rose 3.7% and the NASDAQ Composite gained 3.4%. The large cap S&P 500 added 3%, the mid cap S&P 400 rose 4.1%, and the small cap Russell 2000 gained 5.1%. Major international markets were also green across the board. Canada’s TSX added 2.9% and the United Kingdom’s FTSE gained 1.5%. France’s CAC 40 added 5%, Germany’s DAX rose 3.1%, and Italy’s FTSE MIB gained 4.7%. In Asia, China’s Shanghai Composite surged 13.8% and Japan’s Nikkei rose 2.9%. However, many secondary emerging markets did not fare as well. Emerging markets, as a group, were off -1.5%, while developed markets, as a group, rose 2.5%. Precious metals finished in the red with Gold off -0.7% and Silver down -2.7%. Oil had a strong month of February as West Texas Intermediate crude oil gained 6.4%, and copper also had a strong month, up 5.3%.
U.S. Economic News: Construction on new houses sank to a more than two-year low in December, according to the Commerce Department. The report, which had been delayed due to the recent government shutdown, showed starts had tumbled 11% to an annual rate of just 1.08 million in the last month of 2018 from 1.21 million in November. The reading was the lowest since September 2016. In the details, the biggest decline took place in multi-unit dwellings of two units or more which plummeted 20% in December versus just a 6.7% decline in single-family homes. However, analysts note that the slump is most likely temporary. Building permits, which give an indication of future building activity, edged up 0.3% to a 1.326 million unit rate suggesting a likely pickup in housing starts in the spring.
The National Association of Realtors reported its measure of pending home sales rebounded strongly in January, up 4.6% to 103.2–the first increase in seven months. The consensus was for a much smaller 0.8% gain. Year-over-year, the pace of contract signings was still negative at -2.3%, making January the 13th consecutive month of year-over-year declines. Analysts believe lower mortgage rates and the end of the government shutdown spurred activity. All four regions of the country posted gains, but in the South contract signings surged almost 9%.
In a bit of good news for would-be home buyers, growth in home prices slumped to a 4-year low according to the S&P CoreLogic Case-Shiller Home Price Index. The Case-Shiller 20-city index rose a seasonally-adjusted 0.2% in December and was 4.2% higher than the same time a year ago, but that was the slowest rate of annual growth since November of 2014. Similarly, the National Home Price Index ticked up just 0.3% in December, the least in five months, while its year-over-year change slowed to 4.7%–its slowest pace since August 2015. Of particular interest, while the West has been the best in recent years, December’s report saw Atlanta make it in to the top three for the first time and former high-flyers like Seattle and San Francisco saw tepid price growth on an annual basis and outright declines for the month.
Factory activity across the country slowed in January, weighing on the Chicago Federal Reserve’s National Activity Index (CFNAI). The CFNAI registered a -0.43 for the first reading of the year, a sharp reversal from the positive 0.05 the month before. In the details, the decline was led by production-related indicators. Due to the volatile nature of the monthly data, analysts frequently turn to the less-volatile three-month average, which decreased to a neutral reading last month from a positive 0.16 in December. The CFNAI is a weighted average of 85 economic indicators, designed so that zero represents trend growth and a three-month average above 0.70 suggests an increasing likelihood of a period of sustained inflation.
The nation’s consumers showed a huge rebound in confidence in February as the government shutdown came to an end and the stock market continued its recovery. The Conference Board’s Consumer Confidence Index surged 9.7 points in February to 131.4, exceeding the consensus forecast of just a 3.8 point increase. The reading was the first increase in four months and the biggest gain since August 2015. The rebound in February was led by higher expectations, but consumers’ assessment of present conditions also improved. Confidence was higher across all demographic and most income groups. The current level of confidence remains consistent with above-trend economic growth and suggests consumer spending will remain the driving force of the current expansion.
The Q4 GDP report showed the U.S. economy slowed to a 2.6% annualized rate in the final quarter of last year, down from 3.4% the previous quarter. A slowing housing market and bigger trade deficit weighed after robust growth midyear. Despite slowing, the reading still exceeded economists’ forecasts of 1.9% Q4 growth. The slowdown at the end of 2018 kept the U.S. from reaching at the 3% annual growth level. At 2.9%, 2018 growth matched 2015 as the biggest increase since the end of the 2007-2009 financial crisis.
International Economic News: Canada’s economy practically came to a standstill in the final quarter of last year, shrinking by 0.1% in December. Statistics Canada reported the service sector managed a 0.2% expansion, but was offset by a 0.7% decline in manufacturing. On an annualized basis, GDP grew 0.4% the fourth quarter—the worst quarterly performance in two and half years and well below economists’ expectations for a 1% annualized increase. While a slowdown was widely expected due to lower oil prices, the result was much weaker than most analysts expected. Consumption spending grew at its slowest pace in almost four years, housing fell by the most in a decade, and business investment dropped sharply a second straight quarter.
Confirmation that the British government is considering a Brexit delay caused the pound to surge to one of its biggest gains since the 2016 vote to leave the European Union. The pound rose 1.3% versus the dollar hitting $1.3262, its highest level since September. In addition, the currency hit an almost two-year high versus the euro, above 1.16 euros. However, analysts were quick to point out that extending the Brexit delay beyond March 29 would ease the immediate fears of a “no deal” Brexit, it doesn’t completely take it off the table. Prime Minister Theresa May told lawmakers Tuesday that they will get a vote by the middle of next month on leaving the EU as planned with or without a deal, or whether to request an extension from the other 27 EU member states. David Cheetham, chief market analyst at XTB stated, “The markets clearly see this as a significant step that goes some way to taking ‘no-deal’ off the table, even if the prime minister was at pains to stress that this isn’t the case.”
In a surprising report the European Commission criticized France for its economic “vulnerabilities” due to high public debt and weak competitiveness. “France is experiencing imbalances,” the report said. “Vulnerabilities stem from high public debt and weak competitiveness dynamics in a context of low productivity growth.” Brussels said France’s public debt, at 98.5% of GDP, was forecast to “recede only marginally” and that “reduces the fiscal space available to respond to future shocks and weighs on growth prospects”. In addition, France’s public deficit is expected to hit 3.2% this year, beyond the 3% threshold set by European Union rules. The deficit has been increased by a reduction in taxes and other measures put in place to calm the “yellow vest” anti-government protests. Despite the measures, those protests continued for a 16th consecutive weekend.
Europe’s largest economy, Germany, saw the number of its unemployed citizens fall far more than expected in February and its retail sales surge in January boosting expectations that consumer spending will support growth in the first quarter of 2019. Household spending has become a key driver of growth in Germany as Germans benefit from record-high employment and low borrowing costs. The number of people out of work in Germany decreased by 21,000 to 2.236 million, far more than the drop of 5,000 forecast. The unemployment rate remained at 5.0%, the lowest since German reunification in 1990. In addition, Germany’s Statistics Office showed retail sales jumped 3.3% in January, its strongest rise since October 2016. However in a note, Joerg Zeuner, economist at KfW bank warned that global trade conflicts and uncertainty related to Britain’s expected departure from the European Union were likely to take their toll.
In Asia, research firm Caixin/Markit reported its Purchasing Managers Index (PMI) for China’s manufacturing sector came in at 49.9 for February—its third straight month of contraction (PMI levels below 50 indicate contraction). Although the reading was an improvement from January’s 48.3, it showed that manufacturing activity remained around the contractionary levels not seen since early 2016. The private survey came on the heels of China’s official Purchasing Managers Index which also showed a third straight month of declines. The two surveys offered mixed signals about the strength of China’s manufacturing sector as the private poll actually offered some hope as there was an uptick in activity from the previous month. Julian Evans-Pritchard, senior China economist at Capital Economics, noted that the readings “remain consistent with our expectation for a further slowdown in economic growth in Q1.”
Japan’s factory output posted its biggest decline in a year in January as demand from China stalled. The 3.7% fall in output, which closely tracks broader economic growth, was worse than the median market forecast for a 2.5% decline. It was also the third consecutive month of contraction. Analysts note that the decline is further evidence that the trade tensions between China and the United States are now impacting other countries as well. Adding to the gloom, retail sales in Japan fell short of economists’ forecasts, slowing sharply from the previous month and dashing hopes that domestic demand may offset weaker international demand. Analysts note that weakness at the beginning of this year is likely to continue at least through the first quarter. Koya Miyamae, senior economist at SMBC Nikko Securities noted, “Weak demand was the main factor behind January’s big drop. It is highly likely that output will drop in the first quarter.”
Finally: According to some on Wall Street, the stock market’s monster rally from its Christmas Eve low is hard to explain – or justify – from a fundamental standpoint. The market’s more than 18% comeback coincided with a wave of downward growth and earnings revisions that lowered analysts’ expectations for first-quarter earnings and GDP growth. As Deutsche Bank’s chief international economist Torsten Slok points out, “Either markets have to come down to where growth expectations are, or growth and earnings expectations have to move higher to justify current valuations.” Looking further out, he noted, the Institute for Supply Management’s (ISM) readings and the Purchasing Manager’s Index (PMI) readings are both pointing to more weakness going forward.

(sources: all index return data from Yahoo Finance; Reuters, Barron’s, Wall St Journal, Bloomberg.com, ft.com, guggenheimpartners.com, zerohedge.com, ritholtz.com, markit.com, financialpost.com, Eurostat, Statistics Canada, Yahoo! Finance, stocksandnews.com, marketwatch.com, wantchinatimes.com, BBC, 361capital.com, pensionpartners.com, cnbc.com, FactSet) These are the opinions of WE Sherman and Co and not necessarily those of Cambridge, are for informational purposes only, and should not be construed or acted upon as individualized investment advice.
Securities offered through Registered Representatives of Cambridge Investment Research Inc., a broker-dealer, member FINRA/SIPC. Advisory Services offered through Cambridge Investment Research Advisors, a Registered Investment Adviser. Strategic Investment Partners and Cambridge are not affiliated.
Indices mentioned are unmanaged and cannot be invested into directly. Past performance is no guarantee of future results. All Investing involves risk. Depending on the types of investments, there may be varying degrees of risk. Investors should be prepared to bear loss, including total loss of principal.