
2-25-19 Weekly Market Update
The very big picture:
In the “decades” timeframe, the current Secular Bull Market could turn out to be among the shorter Secular Bull markets on record. This is because of the long-term valuation of the market which, after nine years, has reached the upper end of its normal range.
The long-term valuation of the market is commonly measured by the Cyclically Adjusted Price to Earnings ratio, or “CAPE”, which smooths out shorter-term earnings swings in order to get a longer-term assessment of market valuation. A CAPE level of 30 is considered to be the upper end of the normal range, and the level at which further PE-ratio expansion comes to a halt (meaning that increases in market prices only occur in a general response to earnings increases, instead of rising “just because”).
Of course, a “mania” could come along and drive prices higher – much higher, even – and for some years to come. Manias occur when valuation no longer seems to matter, and caution is thrown completely to the wind as buyers rush in to buy first and ask questions later. Two manias in the last century – the 1920’s “Roaring Twenties” and the 1990’s “Tech Bubble” – show that the sky is the limit when common sense is overcome by a blind desire to buy. But, of course, the piper must be paid and the following decade or two are spent in Secular Bear Markets, giving most or all of the mania gains back.

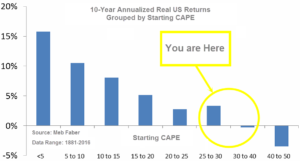
See Fig. 1 for the 100-year view of Secular Bulls and Bears. The CAPE is now at 30.56, up slightly from the prior week’s 30.38, about the level reached at the pre-crash high in October, 2007. Since 1881, the average annual return for all ten year periods that began with a CAPE around this level have been in the 0% – 3%/yr. range. (see Fig. 2).
In the big picture:
The “big picture” is the months-to-years timeframe – the timeframe in which Cyclical Bulls and Bears operate. The U.S. Bull-Bear Indicator (see Fig. 3) is in Cyclical Bull territory at 62.08, up from the prior week’s 59.65.

In the intermediate and Shorter-term picture:
The Shorter-term (weeks to months) Indicator (see Fig. 4) turned positive on November 28th. The indicator ended the week at 36, unchanged from the prior week. Separately, the Intermediate-term Quarterly Trend Indicator – based on domestic and international stock trend status at the start of each quarter – was negative entering January, indicating negative prospects for equities in the first quarter of 2019.

Timeframe summary:
In the Secular (years to decades) timeframe (Figs. 1 & 2), the long-term valuation of the market is simply too high to sustain rip-roaring multi-year returns. The Bull-Bear Indicator (months to years) remains positive (Fig. 3), indicating a potential uptrend in the longer timeframe. In the intermediate timeframe, the Quarterly Trend Indicator (months to quarters) is negative for Q1, and the shorter (weeks to months) timeframe (Fig. 4) is positive. Therefore, with two indicators positive and one negative, the U.S. equity markets are rated as Neutral.
In the markets:
U.S. Markets: The Dow Jones Industrial Average logged its longest streak of weekly gains in nearly 25 years, as stocks finished the week modestly higher. The Dow rose 148 points last week to close at 26,031, a gain of 0.6%. The technology-heavy NASDAQ Composite increased 0.7%, finishing the week at 7,527. By market cap, smaller caps outperformed large caps with the S&P 400 Mid Cap Index and the small cap Russell 2000 gaining 1% and 1.3%, respectively, while the large cap S&P 500 rose 0.6%.
International Markets: Canada’s TSX continued its winning streak by adding 1.1%, while the United Kingdom’s FTSE finished down -0.8%. On Europe’s mainland, France’s CAC 40 rose 1.2%, Germany’s DAX gained 1.4%, and Italy’s Milan FTSE ticked up a more modest 0.2%. In Asia, China’s Shanghai Composite surged 4.5% and Japan’s Nikkei added 2.5%. As grouped by Morgan Stanley Capital International, developed markets rose 0.8% while emerging markets jumped 2.3%.
Commodities: Precious metals finished the week up with Gold rising 0.8% to $1332.80 per ounce, and Silver closed at $15.91 an ounce, a gain of 1.1%. Oil continued its rally, rising 2.3% and closing at $57.26 per barrel of West Texas Intermediate crude. The industrial metal copper, seen as a barometer of world economic health due to its variety of uses, jumped 5.5% this week.
U.S. Economic News: Confidence among the nation’s homebuilders jumped this month to its highest level in four months. The National Association of Home Builder (NAHB) monthly confidence index jumped 4 points to a seasonally-adjusted level of 62 in February, beating consensus estimates of just a one point gain. The index rose for a second straight month, and the increase was the most since December of 2017. Analysts noted higher consumer confidence and lower mortgage rates boosted expectations were responsible for the gain. In addition, all of the index’s subcomponents advanced. However, the NAHB noted in its statement that “affordability remains a critical issue”, regulations are still “excessive”, and the Trump administration’s tariffs have made raw materials more expensive.
Despite the optimism among builders, sales of existing homes continued to decline, dropping 1.2% in January. The National Association of Realtors (NAR) reported sales fell to a 4.94 million unit annual rate—its lowest level since November of 2015 and its third consecutive decline. The reading missed the consensus for a 0.6% increase to a 5.02 million unit rate. Sales fell in three of the four regions, rising only in the Northeast. Single-family homes, which account for over 90% of total sales, fell 1.8% while condo/co-ops rebounded 3.6%. The median price of a home sold in February was $247,500, up 2.8% compared to the same time last year. While some sales were undoubtedly delayed by the government shutdown, inventory shortages persisted. The “Months Available” supply of housing ticked up to 3.9 months from 3.7—still far below the 6 month supply that analysts consider a “balanced” housing market.
Orders for goods intended to last at least three years, so-called “durable goods”, rose 1.2% in December. The result missed consensus estimates of a 1.5% increase. However, analysts noted that in the details of the report things weren’t as good as they seemed. The result was led by orders for costly civilian aircraft and vehicles which can heavily skew the headline number. Ex-transportation, orders ticked up a bare 0.1%. Furthermore, nondefense capital goods orders ex-aircraft, or “core” business orders, were actually off -0.7% and down four of the past five months. Year over year, durable goods orders moderated to 5.3% growth, while core orders edged up slightly to 4.1%. Both were close to their slowest rates since the spring of 2017.
In the city of Brotherly Love, manufacturing activity plunged sharply into negative territory in February for the first time in almost three years. The Philadelphia Fed’s General Business Activity Index dropped 21.1 points last month, the most since August 2011, to -4.1. This level indicates contraction for the first time since May 2016. The consensus estimate was for just a 3 point pullback to 14. In the report’s details, new orders and shipments nosedived, although employment indicators held relatively steady. In the near term, the outlook for factory conditions in the region remained positive and virtually unchanged from the previous month. However, new orders were the weakest in three years, suggesting softer future demand. The inflation outlook also eased.
The Conference Board’s Leading Economic Index (LEI) fell last month suggesting a slowdown in growth, but analysts note there’s a catch. The LEI fell 0.1% in January, missing the consensus forecast of a 0.1% gain, but the latest results were incomplete because of the recently ended government shutdown. Ataman Ozyildirim, director of economic research, stated the decline in the leading index stemmed predominantly from an increase in initial jobless claims and “weaknesses in the labor market”. However three of the index’s ten components—building permits, orders for consumer goods, and orders for capital goods, were missing due to the federal shutdown.
Federal Reserve officials broke into two separate camps over future interest-rate hikes, according to the January meeting minutes released this week. In the release, “several” officials argued that rate increases might be needed only if inflation outcomes were higher than the baseline forecast. However, the minutes also showed several other officials thought it would be appropriate to raise the federal funds rate later this year if the economy evolved as expected. Officials said they thought being patient posed “few risks at this point”. The majority of Fed officials agreed that when the uncertainty over the outlook abated the Fed would reassess its characterization of policy as “patient”. Regarding the Fed’s balance sheet, “almost all” participants wanted to stop reducing the size of the balance sheet later this year and agreeing to reinvest mortgage-backed securities into Treasuries once the runoff stops.
International Economic News: The head of the Bank of Canada stated his benchmark interest rate remains low enough that it’s still delivering stimulus to the economy. Despite raising interest rates five times during this hiking cycle, its key rate remains below the level of inflation currently at 2%, according to Statistics Canada. Speaking in Montreal, the Governor of the BoC Stephen Poloz said Canada’s benchmark interest rate of 1.75% was low enough to lift the economy. Poloz said the central bank will remain “decidedly data-dependent” when evaluating further rate hikes. Analysts expect Canada’s benchmark interest rate destination range to ultimately reach between 2.5 and 3.5%.
The United Kingdom’s Office for National Statistics (ONS) reported its preliminary estimate for GDP growth in the fourth quarter of last year confirmed that the UK economy slowed following a summer of relatively robust economic expansion. The release coincided with the Bank of England’s forecast of slower growth due to continued uncertainty regarding Britain’s exit from the European Union and softer overall global growth. The ONS preliminary estimate of GDP in the fourth quarter showed growth slowing to 0.2% following the third quarter’s 0.6% expansion. The reading meant that overall GDP growth in the UK for 2018 was 1.4%–the weakest since the financial crisis.
On Europe’s mainland, French Finance Minister Bruno Le Maire stated Italy’s recession threatens France’s economic stability. The recession in Italy has set off alarm bells in Paris as the two countries’ economies are deeply integrated with shared companies in multiple sectors and annual trade flows of around $90 billion. “Don’t underestimate the impact of the Italian recession,” Le Maire said in an interview this week. “We talk a lot about Brexit, but we don’t talk much about an Italian recession that will have a significant impact on growth in Europe and can impact France because it’s one of our most important trading partners.” France recorded 0.3% growth in the fourth quarter of last year, while Germany stagnated, and Italy recorded its second quarter of contraction (thereby passing into official recession).
The International Monetary Fund (IMF) warned that Germany is on the brink of recession after lowering its economic forecast. The IMF said Europe’s economic powerhouse is facing another implosion, just months after narrowly avoided falling into a recession. Christine Lagarde, Managing Director of the IMF, cut Germany’s GDP forecast by 0.6% and added it may have to “lower it even further” after growth was adjusted from 1.9% to just 1.3%. Furthermore, the German government now expects just 1% growth because of the weaker global economy, trade conflicts, and the uncertainty over Brexit. Ms. Lagarde urged the German government to do more “meaningful things” with their funds to halt the downgrades, such as investing in future infrastructure projects.
President Trump said the United States and China were moving closer towards a trade agreement and added that the fate of Chinese telecom giant Huawei along with its chief financial officer could be resolved as part of the final deal with Beijing. A Chinese team led by Vice Premier Liu met with U.S. President Donald Trump and Trade Representative Robert Lighthizer in the Oval Office this week. Following those negotiations, President Trump stated that talks would continue through the weekend and that there was a “very, very good chance” of a deal with China being reached. He added that he expected to meet personally with Chinese President Xi Jinping to “work out the final points”.
Japan’s government kept its assessment of the economy unchanged this month, but weak data on corporate sentiment, capital expenditures, and exports showed the economic outlook for the world’s third-largest economy was dimming. Japan’s Cabinet Office, which helps coordinate government policy, said the economy was in a moderate recovery although leaving its assessment that exports have weakened unchanged. Analysts noted that the report released this week did not take into account recent government data that showed Japan’s exports to China in January fell by the most in more than two years.
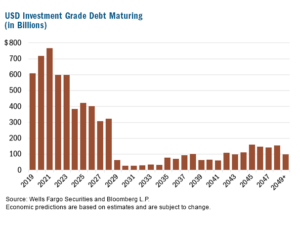
Finally: One area of the fixed income space that hasn’t received much press is investment grade corporate debt. With historically low interest rates, a strong economy, and relaxed lending standards, the prevailing thought was that borrowing to buy back shares or finance acquisitions was a low-risk strategy for a company with a decent balance sheet. What concerns analysts is the sheer size of the unprecedented borrowing that occurred. As shown in the chart below (from Wells Fargo), roughly $3.3 trillion—or 48% of all outstanding commercial debt—will come due in just the next four years. The total volume would be challenging for the market to absorb in the best of economic times, let alone 10 years into an economic expansion. Analysts acknowledge that while the level of debt coming due is not necessarily a sign of an impending financial crisis, it will certainly be a headwind for companies in the intermediate term.
(sources: all index return data from Yahoo Finance; Reuters, Barron’s, Wall St Journal, Bloomberg.com, ft.com, guggenheimpartners.com, zerohedge.com, ritholtz.com, markit.com, financialpost.com, Eurostat, Statistics Canada, Yahoo! Finance, stocksandnews.com, marketwatch.com, wantchinatimes.com, BBC, 361capital.com, pensionpartners.com, cnbc.com, FactSet) These are the opinions of WE Sherman and Co and not necessarily those of Cambridge, are for informational purposes only, and should not be construed or acted upon as individualized investment advice.
Securities offered through Registered Representatives of Cambridge Investment Research Inc., a broker-dealer, member FINRA/SIPC. Advisory Services offered through Cambridge Investment Research Advisors, a Registered Investment Adviser. Strategic Investment Partners and Cambridge are not affiliated.
Indices mentioned are unmanaged and cannot be invested into directly. Past performance is no guarantee of future results. All Investing involves risk. Depending on the types of investments, there may be varying degrees of risk. Investors should be prepared to bear loss, including total loss of principal.