
3-11-19 Weekly Market Update
The very big picture:
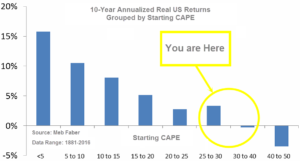
The long-term valuation of the market is commonly measured by the Cyclically Adjusted Price to Earnings ratio, or “CAPE”, which smooths out shorter-term earnings swings in order to get a longer-term assessment of market valuation. A CAPE level of 30 is considered to be the upper end of the normal range, and the level at which further PE-ratio expansion comes to a halt (meaning that increases in market prices only occur in a general response to earnings increases, instead of rising “just because”). The market is currently at that level.
Of course, a “mania” could come along and drive prices higher – much higher, even – and for some years to come. Manias occur when valuation no longer seems to matter, and caution is thrown completely to the wind as buyers rush in to buy first and ask questions later. Two manias in the last century – the 1920’s “Roaring Twenties” and the 1990’s “Tech Bubble” – show that the sky is the limit when common sense is overcome by a blind desire to buy. But, of course, the piper must be paid and the following decade or two are spent in Secular Bear Markets, giving most or all of the mania gains back.

See Fig. 1 for the 100-year view of Secular Bulls and Bears. The CAPE is now at 29.97, down from the prior week’s 30.63, about the level reached at the pre-crash high in October, 2007. Since 1881, the average annual return for all ten year periods that began with a CAPE around this level have been in the 0% – 3%/yr. range. (see Fig. 2).
In the big picture:
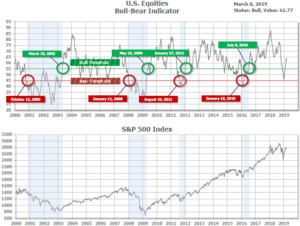
The “big picture” is the months-to-years timeframe – the timeframe in which Cyclical Bulls and Bears operate. The U.S. Bull-Bear Indicator (see Fig. 3) is in Cyclical Bull territory at 61.77, down from the prior week’s 64.43.
In the intermediate and Shorter-term picture:
The Shorter-term (weeks to months) Indicator (see Fig. 4) turned positive on November 28th. The indicator ended the week at 33, down from the prior week’s 36. Separately, the Intermediate-term Quarterly Trend Indicator – based on domestic and international stock trend status at the start of each quarter – was negative entering January, indicating negative prospects for equities in the first quarter of 2019.

Timeframe summary:
In the Secular (years to decades) timeframe (Figs. 1 & 2), the long-term valuation of the market is historically too high to sustain rip-roaring multi-year returns. The Bull-Bear Indicator (months to years) remains positive (Fig. 3), indicating a potential uptrend in the longer timeframe. In the intermediate timeframe, the Quarterly Trend Indicator (months to quarters) is negative for Q1, and the shorter (weeks to months) timeframe (Fig. 4) is positive. Therefore, with two indicators positive and one negative, the U.S. equity markets are rated as Neutral.
In the markets:
U.S. Markets: U.S. stocks performed poorly this week with major indexes suffering declines almost every trading day. The smaller-cap indexes, which are typically more volatile, fared the worst while the technology-heavy Nasdaq Composite had its first weekly decline since late December. The Dow Jones Industrial Average shed 576 points this week to close at 25,450—a decline of -2.2%. Similarly, the NASDAQ finished down -2.5%. By market cap, the large cap S&P 500 fell -2.2%, the mid cap S&P 400 declined -3.4% and the small cap Russell 2000 dropped ‑4.3%.
International Markets: International markets were also hit by selling pressure. Canada’s TSX finished down -0.4%, while the United Kingdom’s FTSE was essentially flat. France’s CAC 40 declined -0.6%, Germany’s DAX fell -1.2%, and Italy’s Milan FTSE ended down -1%. In Asia, China’s Shanghai Composite was off -0.8%, and Japan’s Nikkei retreated -2.7%. As grouped by Morgan Stanley Capital International, developed markets gave up -1.8% while emerging markets fell a slightly greater -2%.
Commodities: Gold failed to benefit from the selling in the financial markets. The precious metal ended the week essentially unchanged, up just $0.10 to $1299.30 an ounce. Silver managed a slightly higher gain, up 0.6% to $15.35 an ounce. Oil retraced some of last week’s declined rising 0.5% to $56.07 per barrel. Copper, commonly seen as a barometer of global economic health due to its variety of uses, finished the week down -1.3%, its second consecutive weekly decline.
U.S. Economic News: The number of people applying for new unemployment benefits fell slightly, keeping jobless claims near their lowest levels in fifty years. The Labor Department reported claims fell by 3,000 to 223,000 in the week ended March 2. Economists had forecast a reading of 225,000. The monthly average of new claims, used to smooth out the weekly volatility, also slipped by 3,000 to 226,250. Continuing claims, which counts the number of people already receiving benefits, declined by 50,000 to 1.76 million. That number is reported with a one-week delay. Thomas Simons, senior market economist at Jeffries LLC, noted that layoff activity in the private sector remained minimal. “Survey evidence suggests that employers are generally having a hard time filling positions, so they’re not particularly inclined to be letting go of the workers they currently have.”
The Bureau of Labor Statistics’ monthly Non-Farm Payrolls report (NFP) showed the U.S. added just 20,000 jobs last month, its smallest increase in over a year and a half. The number of new nonfarm jobs created was well below the consensus forecast of 172,000. Hiring was nil in the construction industry and slumped in the retail and shipping industries. Nonetheless, the pace of hiring was strong enough to put further downward pressure on the nation’s unemployment rate, which fell to just 3.8% from 4%. The NFP report showed hiring was strongest among professional firms and health-care companies. Professional firms created 42,000 new jobs and health providers added 21,000 jobs. They also have been the fastest growing industries throughout the nearly 10-year-old expansion.
Private payrolls-processor ADP reported that private hiring slowed to a three-month low last month. According to the economist who prepared the data, private-sector employment “throttled back” in February as employers added just 183,000 new jobs, compared with 300,000 in January. The gain was very close to forecasts of 180,000. In the details of the report, small firms added 12,000 jobs, medium-sized businesses added 95,000, and large companies added 77,000. The slowdown was most pronounced in retail and travel industries, ADP said. The professional-services sector had the biggest gain in February, followed by health care and education. Mark Zandi, chief economist at Moody’s Analytics, said in a statement, “Job gains are still strong, but they have likely seen their high-water mark for this expansion.” Zandi now sees GDP running at a 0.3% annual rate in the first quarter, far below the 2.6% rate reported in the final quarter of last year. This slowdown “will start to show in payroll data,” he said.
Construction of new homes, known as housing starts, surged nearly 19% in January, the Commerce Department reported. The jump brought the annual pace of housing starts to 1.23 million, higher than the 1.21 million rate forecast. Single-family starts increased an even higher 25% in January to a 926,000 rate. Meanwhile, permits to build new homes—a gauge of future building activity, rose 1.4% to an annual rate of 1.35 million, driven by an increase in multi-family housing. However, permits for single-family homes fell 2.1% in January to a pace of 812,000 units, the lowest level since August 2017, suggesting weakness in single-family homebuilding in the months ahead.
Sales of new homes ticked up in December as the housing market managed a slight gain for 2018. The Commerce Department reported new home sales ran at a seasonally-adjusted annual rate of 621,000, up 3.7% from November, but down 2.4% from the same time a year ago. The December reading beat the consensus forecast of a 600,000 rate, but prior months were given sizable downward revisions. The median sales price was $318,700, down 7% from a year ago. At the current sales pace, the housing market has 6.6 months of available supply, a bit more inventory than is generally considered to be a balanced housing market.
Companies that operate on the “service” side of the economy, which makes up roughly 70% of the U.S. economy, grew last month at their fastest pace in three months. The Institute for Supply Management (ISM) reported its Non-Manufacturing Index rebounded 3.0 points in February, the most in over a year, to 59.7 as services activity accelerated markedly. The consensus was for just a 0.5 point gain to 57.2. In the details, the index for production and new orders both rose sharply to near 65—exceptionally strong readings that are their highest in 14 years. In addition, all 18 of the industries tracked by ISM reported their business expanded in February. Joshua Shapiro of MFR Inc. summed up the report succinctly writing, “Absent a trade war with China, the signal here appears to be that all is well.”
The latest Federal Reserve Beige Book, a collection of anecdotal information on current economic conditions by each of the Federal Reserve’s member banks, found “slight” growth in many regions as the government shutdown weighed. Ten of the Federal Reserve’s 12 districts saw “slight-to-moderate” growth in late January and February, while St. Louis and Philadelphia reported “flat economic conditions”. Overall, the tone of the report was somber. The partial government shutdown led to slower activity in six of the Fed’s districts, with the impact hitting a wide range of sectors including retail, auto sales, tourism, real estate, restaurants, and manufacturing. Consumer spending was “mixed” and several districts said retail and auto sales were lower due to harsh winter weather and higher costs of credit. Analysts widely expect the Fed to hold its benchmark interest rate steady at its meeting later this month.
International Economic News: The Bank of Canada held its key interest rate steady as a longer and deeper slowdown than had been forecast impacts Canada’s economy. Canada’s central bank left its benchmark interest rate unchanged at 1.75% this week and signaled that its policy has entered an extended period of stasis. In its policy statement, Governor Stephen Poloz stated he and his deputies expected slower global economic growth, but the slowdown was “more pronounced and widespread” than had been forecast as recently as January. In addition, they noted that Canada’s economic slowdown in the fourth quarter was also “sharper and more broadly based” than they predicted. After economic growth of 3% in 2017, and 1.8% in 2018, the central bank is bracing for a period of subdued economic activity. Analysts note years of excessive borrowing may finally have caught up with Canadian households, which have cut their spending significantly. In addition, the housing market, exports, and business investment have all gone cold as weak oil prices and trade tensions have weighed on business confidence.
The Organization for Economic Cooperation and Development (OECD) once again warned that a no-deal Brexit would plunge the UK economy into recession and its annual growth would slip below 1% for the first time since the financial crisis even if a deal is secured. The think-tank, which advises 34 of the world’s wealthiest economies, said that even with a smooth Brexit the UK economy would slump to just 0.8% growth in 2019, down from 1.4% in 2018. In November, the same organization was forecasting growth of 1.4% for the UK this year. The OECD said a steep fall in investment over the past year by UK-based firms had left the economy in a weak position to boost its productivity rates and increase wage growth. Like most international agencies, the OECD has warned that leaving the EU will subdue foreign investment into the UK and lower potential growth.
On Europe’s mainland, France unveiled its new “GAFA” digital tax named after the companies it targets: Google, Apple, Facebook, and Amazon. The 3% revenue tax would apply to tech companies that sell digital products from third parties, traffic in user data, or sell digital advertising. The tax would cover around 30 companies so far, and the economy ministry hopes to raise some 500 million euros a year through the new measure. Currently, large digital companies tend to pay less than 10% tax in the European Union, giving them a distinct advantage over traditional businesses that pay an effective rate of 23%. Bruno Le Maire, French economy minister stated, “The tax on the digital giants is a strong measure, expected by the French people, which aims to restore fiscal justice and build the tax policy of the 21st century.” Unsurprisingly, tech industry lobbyists are not keen on the French development.
Europe’s economic powerhouse, Germany, stagnated in the final quarter of 2018 after dropping 0.2% the previous quarter, according to the Halle Institute for Economic Research. The Halle Institute noted one of the main reasons for the weak production levels was slowed international demand during 2018, particularly from Germany’s European partner countries. In addition, many German car manufacturers had not certified parts of their product range before a new exhaust gas testing method took effect in the fall of last year. Car manufacturers were unable to sell a significant proportion of the vehicles produced, which also weakened Germany’s production figures. For 2019, the Halle Institute expects GDP will be 0.5% higher this year than in 2018 and will rise to 2% in 2020.
In Asia, Chinese Premier Li Keqiang set this year’s growth target at 6-6.5%, reflecting the determination of the government to shore up a cooling economy and prevent job losses. If achieved, the growth would be among the world’s strongest, but would be slightly below last year’s 6.6% growth and would mark a three-decade low. At the legislative session in Beijing, Li promised to “promote China-U.S. trade negotiations,” but gave no details of talks aimed at ending the fight with President Donald Trump over Beijing’s technology ambitions and complaints that it steals or pressures companies to hand over technology. Li, No. 2 in the ruling Communist Party behind President Xi Jinping, pledged higher spending on development of technologies including artificial intelligence, electric cars, biotechnology and new materials that China’s leaders see as a path to prosperity and global influence. He also promised more money for education, social programs and public works construction.
Japan may already be in recession, says a key indicator of the health of the Japanese economy. Japan’s Cabinet Office’s “coincident index of business conditions” for January was down 2.7 points from the previous month at 97.9. It was the index’s third consecutive decline, prompting the office to say that it was “signaling a possible turning point.” The latest assessment, based on factors such as a slowdown in industrial output amid falling exports to China show the economy likely peaked in autumn. Shinichiro Kobayashi, an analyst at Mitsubishi UFJ Research and Consulting Co. noted, “The economy is at a crossroad…Exports are key, and the outcome of trade talks between the United States and China will be crucial.”
Finally: Is the current bull market one of the longest on record or a brand-new newborn? Well, as Mark Hulbert noted in a column on MarketWatch.com, that depends on what benchmark index(es) you look at. If you believe the widely-accepted definition of a bear market as a 20% decline in one or more of the major market averages, there have been at least two and perhaps three bear markets since 2009! The first came in 2011 as three out of the four major indexes shown below all declined more than 20%. In 2015, the Russell 2000 fell more than 20% and the NASDAQ came close. And most recently, in 2018, both the small cap Russell 2000 and technology-heavy NASDAQ Composite fell more than 20%, and the S&P 500 came within a whisker. So, though most believe the current bull has run continuously since March of 2009 and is susceptible to dying of old age, it’s possible that the current bull market hasn’t even begun to walk yet!

(sources: all index return data from Yahoo Finance; Reuters, Barron’s, Wall St Journal, Bloomberg.com, ft.com, guggenheimpartners.com, zerohedge.com, ritholtz.com, markit.com, financialpost.com, Eurostat, Statistics Canada, Yahoo! Finance, stocksandnews.com, marketwatch.com, wantchinatimes.com, BBC, 361capital.com, pensionpartners.com, cnbc.com, FactSet) These are the opinions of WE Sherman and Co and not necessarily those of Cambridge, are for informational purposes only, and should not be construed or acted upon as individualized investment advice.
Securities offered through Registered Representatives of Cambridge Investment Research Inc., a broker-dealer, member FINRA/SIPC. Advisory Services offered through Cambridge Investment Research Advisors, a Registered Investment Adviser. Strategic Investment Partners and Cambridge are not affiliated.
Indices mentioned are unmanaged and cannot be invested into directly. Past performance is no guarantee of future results. All Investing involves risk. Depending on the types of investments, there may be varying degrees of risk. Investors should be prepared to bear loss, including total loss of principal.