
3-1-21 Weekly Market Update
The very Big Picture
The long-term valuation of the market is commonly measured by the Cyclically Adjusted Price to Earnings ratio, or “CAPE”, which smooths-out shorter-term earnings swings in order to get a longer-term assessment of market valuation. A CAPE level of 30 is considered to be the upper end of the normal range, and the level at which further PE-ratio expansion comes to a halt (meaning that further increases in market prices only occur as a general response to earnings increases, instead of rising “just because”). The market was recently at that level.
Of course, a “mania” could come along and drive prices higher – much higher, even – and for some years to come. Manias occur when valuation no longer seems to matter, and caution is thrown completely to the wind – as buyers rush in to buy first, and ask questions later. Two manias in the last century – the “Roaring Twenties” of the 1920s, and the “Tech Bubble” of the late 1990s – show that the sky is the limit when common sense is overcome by a blind desire to buy. But, of course, the piper must be paid, and the following decade or two were spent in Secular Bear Markets, giving most or all of the mania-gains back.
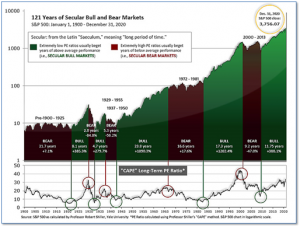
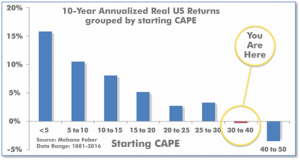
See Fig. 1 for the 100-year view of Secular Bulls and Bears. The CAPE is now at 34.51, down from the prior week’s 35.58. Since 1881, the average annual return for all ten-year periods that began with a CAPE in the 30-40 range has been slightly negative (see Fig. 2).
Note: We do not use CAPE as an official input into our methods. However, if history is any guide – and history is typically ‘some’ kind of guide – it’s always good to simply know where we are on the historic continuum, where that may lead, and what sort of expectations one may wish to hold in order to craft an investment strategy that works in any market ‘season’ … whether current one, or one that may be ‘coming soon’!
The Big Picture:
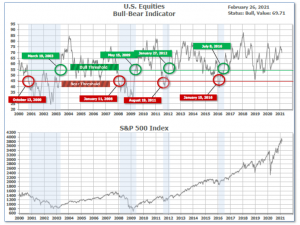
The ‘big picture’ is the (typically) years-long timeframe – the timeframe in which Cyclical Bulls and Bears operate. The U.S. Bull-Bear Indicator is in Cyclical Bull territory at 69.71 down from the prior week’s 72.75.
In the Quarterly- and Shorter-term Pictures
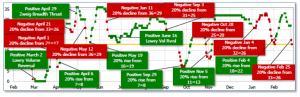
The Quarterly-Trend Indicator based on the combination of U.S. and International Equities trend-statuses at the start of each quarter – was Positive entering January, indicating positive prospects for equities in the first quarter of 2021.
Next, the short-term(weeks to months) Indicator for US Equities turned negative on February 25 and ended the week at 18, down from the prior week’s 29.
In the Markets:
U.S. Markets: The major U.S. benchmarks pulled back sharply in response to a steep rise in longer-term treasury interest rates. The S&P 500 recorded its biggest weekly decline in a month, while the technology-heavy NASDAQ Composite suffered its worst drop since October. The narrowly-focused Dow Jones Industrial Average shed 562 points finishing the week at 30,932, a decline of -1.8%. The NASDAQ Composite ended the week down -4.9%. By market cap, the large cap S&P 500 declined -2.4%, while the mid cap S&P 400 and small cap Russell 2000 retreated -1.5% and ‑2.9%, respectively.
International Markets: Major international markets sold off last week as well. Canada’s TSX declined ‑1.8%, while the United Kingdom’s FTSE ended down -2.1%. On Europe’s mainland, France’s CAC 40 gave up -1.2% and Germany’s DAX shed -1.5%. In Asia, China’s Shanghai Composite plunged -5.1%, and Japan’s Nikkei gave up -3.5%. As grouped by Morgan Stanley Capital International, developed markets ended down -2.9%, while emerging markets dropped a rather large ‑6.6%.
Commodities: Precious metals were no port in the storm of declining equities markets, and sold off along with the broader indexes. Gold declined by -$48.60 to $1728.80 an ounce, a decline of -2.7%, while Silver fell -$0.81 to $26.44 an ounce, down -3.0%. Energy continued its rise. West Texas Intermediate crude oil finished the week up 3.8% to $61.50 per barrel. The industrial metal copper finished the week up 0.5%.
February Summary: For the month of February, the Dow rose 3.2% and the NASDAQ added 0.9%. The S&P 500 rose 2.6%, while mid caps and small caps surged 6.7% and 6.1%, respectively. Canada rose 4.2% and the UK added 1.2%. France and Germany rallied 5.6% and 2.6%, respectively. In Asia, China ticked up 0.7%, while Japan jumped 4.7%. Developed markets finished the month up 2.2%, while emerging markets added just 0.8%. Gold and Silver finished the month down -6.6% and -1.7%, respectively, while the “economy reopening” plays did just fine: Copper gained 15.0% and Oil rallied 17.8%.
U.S. Economic News: The number of Americans filing first-time unemployment benefits fell last week, but the labor market remains under pressure. The Department of Labor reported initial jobless claims fell to 730,000 for the week ended February 20th. That was well below the 845,000 economists had expected, and a sharp decline from the previous week. Despite the decline, jobless claims remain far above their levels from just before the onset of the coronavirus pandemic. Continuing claims decreased by 101,000 to 4.42 million, the lowest reading since March 21st of last year.
A recent Conference Board survey suggests that the U.S. economy is still growing and likely to accelerate in the next six months. The Conference Board reported its Leading Economic Index (LEI) rose 0.5% last month, following gains of 0.4% and 0.9% the prior two months. The survey noted that as vaccinations accelerate, labor markets and overall growth are likely to continue improving. Ataman Ozyildirim, senior director of economic research at the board stated, “While the pace of increase in the U.S. LEI has slowed since mid-2020, January’s gains were broad-based and suggest economic growth should improve gradually over the first half of 2021.”
Home prices rose at their fastest pace in seven years according to a widely followed real estate barometer. The S&P CoreLogic Case-Shiller 20-city home price index posted a 10.1% annual gain in December—a 9.2% increase from the previous month. On a monthly basis, the index increased 0.8% between November and December. Selma Hepp, deputy chief economist at CoreLogic noted it was the first time home prices saw a double-digit year-over-year increase since January 2014. Additionally, the broader S&P Corelogic Case-Shiller national price index, which covers the entire country, demonstrated a 10.4% gain year-over-year in December, up from 9.5% the prior month. Prices rose in 18 of the 20 large cities tracked by Case-Shiller. Phoenix, Ariz. experienced the largest price increase for the 19th consecutive month with a 14.4% increase, followed again by Seattle (13.6%) and San Diego (13%).
Sales of newly built homes rose as the number of buyers outpaced the number of homes available for sale. On an annual basis, sales of new homes were up 19% to 923,000 in January, according to data from the U.S. Census Bureau. That was 4.3% above the annual rate of 885,000 in December. The reading exceeded analyst expectations of 850,000. In the details, new-home sales rose across most parts of the country led by a 12.6% increase in the Midwest. The Northeast was the only region where sales declined—dropping nearly 14%. Inventory dropped to just a four-month supply. A six-month supply of homes for sale is generally considered a “balanced” housing market. The median price of a new home was $346,400 in January, down 2% from December.
Orders for goods expected to last at least three years, so-called “durable goods”, posted their biggest gain in six months in January—a good sign for the economy going forward. The Census Bureau reported durable goods orders rose 3.4% last month. Economists had expected just a 1% advance. Orders have now returned to their pre-crisis levels, reflecting a shift among consumers towards the purchases of goods such as new cars, appliances, electronics and so forth. The report shows the increase in orders was led by a large increase in orders for passenger jets and military hardware. Excluding transportation, durable-goods orders rose a more modest 1.4%. “Core orders”, which excludes the often volatile defense and transportation segments edged up 0.5% in January—its ninth consecutive increase.
In prepared remarks for the Senate Banking Committee, Federal Reserve Chair Jerome Powell said inflation and employment remain well below the Federal Reserve’s goals, meaning easy monetary policies are likely to stay in place. Despite a sharp rise in bond yields this year that has heightened concern over inflation, Powell said price pressures remain mostly muted and the economic outlook is still “highly uncertain”. The economy is a long way from our employment and inflation goals, and it is likely to take some time for substantial further progress to be achieved,” the Fed chief said. The Fed last year revised its approach to inflation. In the past, it would levy preventive rate hikes when it saw unemployment drop, thinking that a stronger job market would push up prices. Now, it has adopted an approach in which it will allow inflation to average above 2% for a period of time before moving to tighten policy.
A measure of business conditions in the Chicago area retreated in February from a strong reading in the prior month. MNI Market News International reported its Chicago Business Barometer softened to 59.5 in February from a strong 63.8 reading in January. The January reading was its highest since July 2018. Economists had expected the index to slip, but only to 61. Still, readings above 50 indicate improving conditions. The index, also known as the Chicago Purchasing Managers Index, is the last of the regional manufacturing indices before the closely-watched national ISM data for February is released next week. Lewis Alexander, chief economist at Nomura, expects a slight decline in the ISM manufacturing index to 58.5 in February. “While we think the manufacturing sector growth outlook remains firm, power outages [mostly in Texas and Plains states] and low temperatures led to temporary disruptions in production,” he said in a note to clients.
International Economic News: Bank of Canada governor Tiff Macklem anticipates Canada’s economy will see a solid and sustained rebound this year as the number of COVID-19 inoculations continues to increase. Speaking in Alberta, Macklem stated as more Canadians are inoculated, the hardest-hit segments of the economy will be able to begin resuming operations, resulting in strong jobs growth. “Clearly getting vaccines into Canada and into Canadians is top priority,” he said. “The sooner we achieve widespread immunity and can get back to more normal activities, the stronger and more sustained will be the recovery.” Of note, addressing an audience question about the housing market, Macklem said for the first time that the central bank is starting to see signs of froth in Canada’s hot housing market. “We are starting to see some early signs of excess exuberance,” he said.
Across the Atlantic, the British government declared this week that every adult in the UK should receive their first COVID vaccine shot by July 31st—at least a month earlier than its previous target. The makers of the two vaccines that Britain is using, Pfizer and AstraZeneca, have both experienced supply problems in Europe, but UK Health Secretary Matt Hancock said he now believes they have the supplies to speed up the nationwide vaccination campaign. News of the new vaccine targets came as Prime Minister Boris Johnson met with senior ministers to finalize a “road map” out of the national lockdown.
On Europe’s mainland, the French economy shrank more than expected in the fourth quarter of last year, data from the country’s statistics agency INSEE showed. In the October-December period, gross domestic product shrank 1.4% from the previous quarter–0.1 percentage point more than the preliminary estimate of a 1.3% contraction released in January. GDP contracted 4.9% from the same time a year earlier. The French economy–the Eurozone’s second largest–is expected to contract again in the first quarter of 2021, as extended government restrictions to contain the coronavirus hinder economic activity.
Business morale in Europe’s economic powerhouse – Germany – bounced back from a six-month low last month, thanks to a brighter industrial outlook and well-stocked order books, recent data showed. The Ifo Economic Institute reported its business climate index increased 2.1 points to 92.4 in January, hitting its highest level since October and surpassing economists’ estimates. “The German economy is looking towards recovery again,” Ifo economist Klaus Wohlrabe stated. Germany, once a role model for fighting the COVID-19 pandemic, has struggled with a second wave. But Wohlrabe said companies have now revised up production plans significantly and export expectations for the industry have also risen. “The order books are well filled,” he added.
In Asia, Bank of America head of Asia economics Helen Qiao said China stands a good chance of doubling the size of its economy by 2035—and will surpass the United States along the way. Doubling of China’s GDP will require annual growth of 4.7% for the next 15 years, but Qiao said reform measures will help China get there. China was one of the few global economies that grew in 2020 despite the challenges posed by the COVID-19 pandemic. Official data showed the Chinese economy expanded by 2.3% last year, according to the International Monetary Fund.
Japan’s industrial output rose for the first time in three months in January, thanks to a rebound in global demand. Official data showed factory output advanced 4.2% in January, boosted by sharp rises in production of electronic parts and general-purpose machinery, as well as a smaller increase in car output. Taro Saito, executive research fellow at NLI Research Institute stated, “Manufacturers will continue to increase output over the near term as long as there won’t be any big shock.” While economic growth will likely be negative in the first quarter, the strength in manufacturing should offset the negative impact of Japan’s state of emergency, which is mainly impacting the services sector.
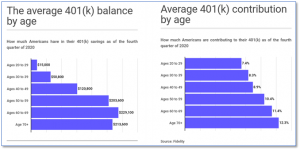
Finally: Finally, for most young people, retirement is pretty much the last thing on their minds as they enter the workforce. Still, almost everyone knows that the sooner saving for retirement is begun, the better off they’ll eventually be. Last year was a tough year financially for most average Americans. Between March 2020 and January 2021, around 1.6 million people took money out of their 401(k) plans under the CARES Act. However, despite the volume of withdrawals, around a third of 401(k) savers managed to increase their savings. So how much money does the average American now have in his/her retirement account? Fidelity provided CNBC with the average amount of money Americans have saved in retirement accounts as of the fourth quarter of 2020, as well as contribution by % of salary, broken out by age cohort.
(Sources: All index- and returns-data from Yahoo Finance; news from Reuters, Barron’s, Wall St. Journal, Bloomberg.com, ft.com, guggenheimpartners.com, zerohedge.com, ritholtz.com, markit.com, financialpost.com, Eurostat, Statistics Canada, Yahoo! Finance, stocksandnews.com, marketwatch.com, wantchinatimes.com, BBC, 361capital.com, pensionpartners.com, cnbc.com, FactSet.) Securities offered through Registered Representatives of Cambridge Investment Research Inc., a broker-dealer, member FINRA/SIPC. Advisory Services offered through Cambridge Investment Research Advisors, a Registered Investment Adviser. Strategic Investment Partners and Cambridge are not affiliated. Indices mentioned are unmanaged and cannot be invested into directly. Past performance is no guarantee of future results.