2-22-21 Weekly Market Update
The very Big Picture
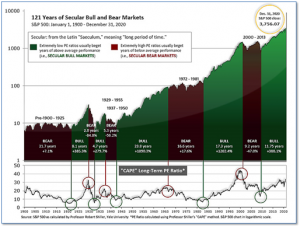
The long-term valuation of the market is commonly measured by the Cyclically Adjusted Price to Earnings ratio, or “CAPE”, which smooths-out shorter-term earnings swings in order to get a longer-term assessment of market valuation. A CAPE level of 30 is considered to be the upper end of the normal range, and the level at which further PE-ratio expansion comes to a halt (meaning that further increases in market prices only occur as a general response to earnings increases, instead of rising “just because”). The market was recently at that level.
Of course, a “mania” could come along and drive prices higher – much higher, even – and for some years to come. Manias occur when valuation no longer seems to matter, and caution is thrown completely to the wind – as buyers rush in to buy first, and ask questions later. Two manias in the last century – the “Roaring Twenties” of the 1920s, and the “Tech Bubble” of the late 1990s – show that the sky is the limit when common sense is overcome by a blind desire to buy. But, of course, the piper must be paid, and the following decade or two were spent in Secular Bear Markets, giving most or all of the mania-gains back.

See Fig. 1 for the 100-year view of Secular Bulls and Bears. The CAPE is now at 35.58, down from the prior week’s 35.83. Since 1881, the average annual return for all ten-year periods that began with a CAPE in the 30-40 range has been slightly negative (see Fig. 2).

Note: We do not use CAPE as an official input into our methods. However, if history is any guide – and history is typically ‘some’ kind of guide – it’s always good to simply know where we are on the historic continuum, where that may lead, and what sort of expectations one may wish to hold in order to craft an investment strategy that works in any market ‘season’ … whether current one, or one that may be ‘coming soon’!
The Big Picture:
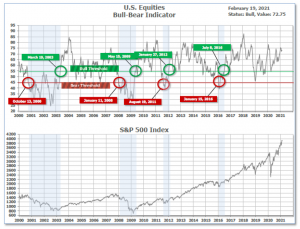
The ‘big picture’ is the (typically) years-long timeframe – the timeframe in which Cyclical Bulls and Bears operate. The U.S. Bull-Bear Indicator is in Cyclical Bull territory at 72.75 down from the prior week’s 73.22.

In the Quarterly- and Shorter-term Pictures
The Quarterly-Trend Indicator based on the combination of U.S. and International Equities trend-statuses at the start of each quarter – was Positive entering January, indicating positive prospects for equities in the first quarter of 2021.
Next, the short-term(weeks to months) Indicator for US Equities turned negative on January 4 and ended the week at 29, down from the prior week’s 32.

In the Markets:
U.S. Markets: The major U.S. indexes finished the week mostly to the downside with the large-cap benchmarks and technology-heavy NASDAQ Composite index hitting record intraday highs before falling back. The Dow Jones Industrial Average ticked up 0.1% to 31,494, its third consecutive week of gains. The NASDAQ reversed most of last week’s gain finishing down -1.6%. By market cap, the large cap S&P 500 gave up -0.7%, while the mid cap S&P 400 and small cap Russell 2000 retreated -0.4% and -1.0%, respectively.
International Markets: International markets were mixed on the week. Canada’s TSX retreated -0.4%, while the United Kingdom’s FTSE 100 added 0.5%. On Europe’s mainland, France’s CAC 40 and Germany’s DAX finished mixed with the CAC rising 1.2%, while the DAX declined -0.4%. Markets finished the week in the green in Asia. China’s Shanghai Composite rose 1.1%, while Japan’s Nikkei added 1.7%. As grouped by Morgan Stanley Capital International, developed markets ticked down -0.1%, while emerging markets fell a steeper -0.5%.
Commodities: Precious metals finished the week to the downside. Gold fell by $45.80 to $1777.40 an ounce, a decline of -2.5%. Silver closed down -0.3% to $27.25 per ounce. Following two weeks of strong gains, energy ended the week lower. West Texas Intermediate crude oil declined -0.4% to $59.26 per barrel. Copper, viewed by some analysts as a barometer of world economic health due to its wide variety of industrial uses, surged over 7.5% last week.
U.S. Economic News: The number of Americans claiming first-time unemployment benefits rose last week to a four-week high, as Americans continue losing their jobs nearly a year after the onset of the coronavirus pandemic. The Labor Department reported initial jobless claims rose by 13,000 to 861,000. Economists had expected new claims would fall to 770,000. New applications for jobless benefits rose the most in Illinois, California and Virginia, while the biggest declines took place in Texas and Georgia. Continuing claims, which counts the number of people already collecting traditional unemployment benefits, fell by 64,000 to a seasonally adjusted 4.49 million.
Sales of existing homes ticked up 0.6% to a seasonally-adjusted annual rate of 6.69 million, the National Association of Realtors (NAR) reported. Home sales were up 23.7% compared with the same time last year. The median existing-home price rose to $303,900, a 14.1% increase from a year ago. Furthermore, the inventory of homes for sale fell to record low of just 1.04 million units—that’s a 25.7 decline from the same time last year. Overall, the market now has just a 1.9 month supply of homes for sale. Economists generally consider a 6-month supply a balanced housing market.
Confidence among the nation’s home builders improved, but high construction costs remain a concern. The National Association of Home Builders’ (NAHB) reported its monthly confidence index rose one point to 84 in February as foot traffic from home buyers improved. The modest increase comes following two consecutive months of declines. In the details, the index that measures sentiment of prospective buyers increased four points to 72. Despite high demand, the NAHB voiced its concern over rising costs of building materials. Chuck Fowke, current chairman of the National Association of Home Builders stated, “Lumber prices have been steadily rising this year and hit a record high in mid-February, adding thousands of dollars to the cost of a new home and causing some builders to abruptly halt projects at a time when inventories are already at all-time lows.”
Manufacturing activity in the New York-region hit its highest level in seven months according to the latest report from the New York Fed. The Fed’s Empire State business conditions index rose 8.6 points to 12.1 in February—more than double economists’ estimates. Economists had expected a reading of just 5.9. In the report, the new orders index rose 4.2 points to 10.8, while shipments fell 3.3 points to 4. Notably, prices paid for goods jumped 12.3 points to 57.8 – the highest level since 2011. Manufacturers’ expectations for business conditions in the next six months rose 3 points to 34.9.
Sales at the nation’s retailers jumped last month, as stimulus checks helped boost the nation’s economy. The Census Bureau reported retail sales surged 5.3% in January, its first increase in four months and the largest increase in eight months. Economists had expected just a 1% increase. In the details, sales were strong in every category. Department store chains, Internet retailers, electronic stores and home-furnishing outlets all recorded double digit percentage gains. Bars and restaurants also registered a nearly 7% increase in sales after receipts had fallen three months in a row. The increase in spending was fueled in part by $600 stimulus checks sent to millions of Americans and more generous unemployment benefits. Economist Katherine Judge of CIBC Economics wrote in a note, “With additional fiscal stimulus on the way, new Covid cases trending lower, and many states moving to relax social distancing measures, the worst looks to be in the rear view mirror.”
Prices at the producer level posted their biggest surge since 2009, but some analysts stated it is unlikely to be sustained. The Labor Department reported the Producer Price Index jumped 1.3% last month. Economists had forecast a 0.5% gain. Over the past 12 months, the rate of wholesale inflation climbed to 1.7 in January, from just 0.8% at the end of 2020. Most of the increase in wholesale prices last month was tied to higher costs of gasoline, health care and financial services. Energy prices have risen in the past several months as more people have resumed traveling, the weather has turned colder, and supplies have tightened. The core rate of wholesale inflation, which strips out the often-volatile food and energy categories, also surged by 1.3%. The increase in the core rate over the past 12 months nearly doubled in January to 2% from 1.1% in December and is now above pre-pandemic levels.
Minutes of the January meeting of the Federal Reserve showed officials were more optimistic about the long-term health of the economy. The voting members of the Fed’s interest-rate committee agreed that expected progress on vaccinations and the change in the outlook for fiscal policy had improved the longer-run prospects for the economy so much that officials “decided that the reference in previous post-meeting statements to risks to the economic outlook over the medium term was no longer warranted,” according to the minutes. Notably, Fed officials were seemingly not concerned about inflation, with “most” officials saying that inflation risks were weighted towards too low rather than too high.
International Economic News: Canada’s Members of Parliament voted in favor of forming a special economic relations committee with the United States. The motion passed in the House of Commons by a vote of 326 to 3. The Conservatives, who introduced the motion earlier this month, argued that due to the ongoing coronavirus pandemic, Canada needs a “serious plan for the economic recovery that recognizes the integration of the North American economy.” In a statement, Conservative Leader Erin O’Toole said the committee will “help advance one of (the) most important pillars of our recovery, the economic relationship between Canada and the United States.”
Across the Atlantic, a brighter economic outlook and quick vaccine rollout have boosted consumer confidence in the United Kingdom to its highest level in almost a year. The UK consumer confidence index, a measure of how people view the state of their personal finances and wider economic prospects, rose 5 points to an 11-month high of -23 in February, according to closely watched data published by research company GfK. The uptick was stronger than the consensus forecast of -27. The improved sentiment has fueled hopes of a strong rebound in consumer spending. Joe Staton, GfK’s client strategy director, said that the jump in the headline confidence score, driven by a 14-point rise in the outlook for the economy over the coming year, made it “tempting to talk of a return to normality”.
On Europe’s mainland, France took another step towards economic protectionism by rejecting the acquisition of food retailer Carrefour by Canada’s Couche-Tard group. “Food sovereignty” was cited as the reason for the move, on the grounds that deals that require foreign direct investment screening include those that affect “food security”. France, like other European countries, has drawn up a list of “sensitive” sectors in which certain takeovers need government approval. Food security was added in a new rule that took effect last year.
Investor morale in Germany surged beyond even the most optimistic forecast this month on expectations consumption will take off in the coming months. The ZEW economic research institute reported its survey of investors’ economic sentiment showed a rise to 71.2 points from 61.8 in January. Economists had expected a decline to 59.6. “The financial market experts are optimistic about the future. They are confident that the German economy will be back on the growth track within the next six months,” ZEW President Achim Wambach said in a statement. “Consumption and retail trade in particular are expected to recover significantly, accompanied by higher inflation expectations,” he added.
In Asia, China’s economy is likely to be the world’s second largest in 2050, still trailing the U.S., according to recent analysis. London-based Capital Economics forecasts that China’s economic clout will not increase steadily relative to the U.S. through time, due in part to the Chinese workforce declining by more than 0.5% a year by 2030. Meanwhile, the report notes, the U.S. workforce will expand over that same time supported by relatively higher fertility and immigration. “The most likely scenario is that slowing productivity growth and a shrinking workforce prevent China ever passing the U.S.,” the analysis said. Capital Economics’ chief Asia economist, Mark Williams, who wrote the analysis, said that China’s growth is slowing mainly because leader Xi Jinping has rejected efforts to open up the economy.
For the first time in 10 months, Japan’s government cut its view on the overall economy as an extended state of emergency to curb coronavirus infections weighed on consumer spending and business activity. In its monthly report, Japan’s Cabinet Office said the economy is showing “weakness in some components” and remains in a severe situation due to the pandemic. Economy Minister Yasutoshi Nishimura said “Now is the time for fiscal spending and the government must commit to preventing a return of deflation.” The government estimates the economy will expand 4.0% in the next fiscal year starting in April, after an expected 5.2% fall in the current fiscal year to March.
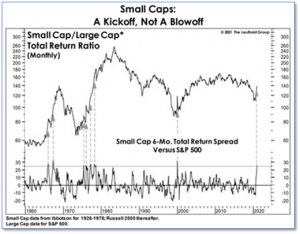
Finally: For the past several months, small-caps have greatly outperformed large-caps. Many observers have derided it as a “blow off” of excess that will soon reverse, but researchers at the Leuthold Group disagree. Instead, they point out that similar periods of “extreme strength” have kicked off periods of multi-year leadership by small-caps. The chart below, from The Leuthold Group, shows that in every one of the 7 prior instances of a 25% total-return differential between the 6‑month returns of the Russell 2000 small-cap index and the S&P 500 large-cap index, the dominance of the small-caps continued for another 2 to 10 years. Thus, they argue that the surge in small-caps is more likely to be a “Kickoff” than a “Blow off”.

(Sources: All index- and returns-data from Yahoo Finance; news from Reuters, Barron’s, Wall St. Journal, Bloomberg.com, ft.com, guggenheimpartners.com, zerohedge.com, ritholtz.com, markit.com, financialpost.com, Eurostat, Statistics Canada, Yahoo! Finance, stocksandnews.com, marketwatch.com, wantchinatimes.com, BBC, 361capital.com, pensionpartners.com, cnbc.com, FactSet.) Securities offered through Registered Representatives of Cambridge Investment Research Inc., a broker-dealer, member FINRA/SIPC. Advisory Services offered through Cambridge Investment Research Advisors, a Registered Investment Adviser. Strategic Investment Partners and Cambridge are not affiliated. Indices mentioned are unmanaged and cannot be invested into directly. Past performance is no guarantee of future results.
