
2-5-18 Market Update
2-5-18 Market Update
The very big picture:
In the “decades” timeframe, the current Secular Bull Market could turn out to be among the shorter Secular Bull markets on record. This is because of the long-term valuation of the market which, after only eight years, has reached the upper end of its normal range.
The long-term valuation of the market is commonly measured by the Cyclically Adjusted Price to Earnings ratio, or “CAPE”, which smooths out shorter-term earnings swings in order to get a longer-term assessment of market valuation. A CAPE level of 30 is considered to be the upper end of the normal range, and the level at which further PE-ratio expansion comes to a halt (meaning that increases in market prices only occur in a general response to earnings increases, instead of rising “just because”).
Of course, a “mania” could come along and drive prices higher – much higher, even – and for some years to come. Manias occur when valuation no longer seems to matter, and caution is thrown completely to the wind as buyers rush in to buy first and ask questions later. Two manias in the last century – the 1920’s “Roaring Twenties” and the 1990’s “Tech Bubble” – show that the sky is the limit when common sense is overcome by a blind desire to buy. But, of course, the piper must be paid and the following decade or two are spent in Secular Bear Markets, giving most or all of the mania gains back.
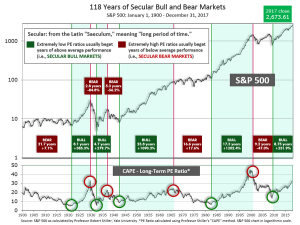
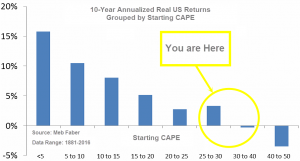
See Fig. 1 for the 100-year view of Secular Bulls and Bears. The CAPE is now at 33.40, down from the prior week’s 34.75, and exceeds the level reached at the pre-crash high in October, 2007. This value is in the lower end of the “mania” range. Since 1881, the average annual return for all ten year periods that began with a CAPE around this level have been in the 0% – 3%/yr. range. (see Fig. 2).
In the big picture:
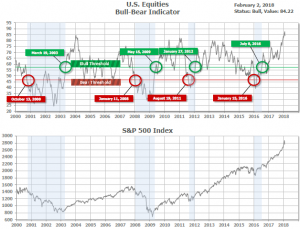
The “big picture” is the months-to-years timeframe – the timeframe in which Cyclical Bulls and Bears operate. The U.S. Bull-Bear Indicator (see Fig. 3) is in Cyclical Bull territory at 84.22, down from the prior week’s 87.59.
In the intermediate and Shorter-term picture:
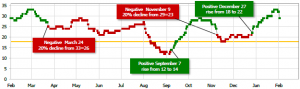
The Shorter-term (weeks to months) Indicator (see Fig. 4) turned positive on December 27th. The indicator ended the week at 29, down from the prior week’s 33. Separately, the Intermediate-term Quarterly Trend Indicator – based on domestic and international stock trend status at the start of each quarter – was positive entering January, indicating positive prospects for equities in the first quarter of 2018.
Timeframe summary:
In the Secular (years to decades) timeframe (Figs. 1 & 2), the long-term valuation of the market is simply too high to sustain rip-roaring multi-year returns – but the market has entered the low end of the “mania” range, and all bets are off in a mania. The only thing certain in a mania is that it will end badly…someday. The Bull-Bear Indicator (months to years) is positive (Fig. 3), indicating a potential uptrend in the longer timeframe. In the intermediate timeframe, the Quarterly Trend Indicator (months to quarters) is positive for Q1, and the shorter (weeks to months) timeframe (Fig. 4) is also positive. Therefore, with internal unanimity expressed by all three indicators being positive, the U.S. equity markets are rated as Positive.
In the markets:
U.S. Markets: Stocks recorded their first weekly loss of the young year, with the large-cap S&P 500 index suffering its worst weekly drop in two years. All major markets finished the week in the red with the Dow Jones Industrial Average falling -4.1% to close at 25,520, while the technology-heavy NASDAQ Composite fell -3.5%. By market cap, small caps fared slightly better than their larger cap brethren. The Russell 2000 small-cap index retreated -3.8%, while the large-cap S&P 500 and mid-cap S&P 400 each lost -3.9%.
International Markets: The selling impacted major international markets as well. Canada’s TSX had a second down week, losing -3.9%. The United Kingdom’s FTSE fell a third consecutive week losing -2.9%. On Europe’s mainland, France’s CAC 40 fell -3%, Germany’s DAX plunged -4.2%, and Italy’s Milan FTSE ended down -2.7%. In Asia, China’s Shanghai Composite reversed last week’s 2% rise by falling -2.7%, Japan’s Nikkei closed down ‑1.5% and Hong Kong’s Hang Seng dropped -1.7%. As grouped by Morgan Stanley Capital International, developed markets fell -3.6% while emerging markets plunged -5.8%.
Commodities: Precious metals turned out to be of little value as a safe haven amid the market weakness. Gold retreated -1.1% to $1337.30 an ounce, while Silver plunged -4.2% to $16.71 an ounce. Energy was also weak, as oil traded down -1% to $65.45 per barrel of West Texas Intermediate crude oil. Copper, which some analysts use as an indicator of global economic health due to its variety of uses, fell just -0.4%.
January Summary: For the month of January, the Dow gained 5.8%, while the NASDAQ jumped 7.4%. Small caps rose a relatively lackluster 2.6%, mid caps an equally mediocre 2.8%, while large caps (S&P 500) jumped 5.6%. International markets were not as unanimously positive, but overall quite strong. Canada’s TSX fell -1.6%, the UK’s FTSE fell -2.1%, France’s CAC 40 rose 3.2% and Germany’s DAX finished January up 2.1%. In Asia, China’s Shanghai Composite rose by 5.25%, Japan’s Nikkei finished up 1.5%, and Hong Kong’s Hang Seng led all major international markets with a huge gain of +9.9% for January. As grouped by Morgan Stanley Capital International, developed markets jumped 5.0% and emerging markets ripped higher by 8.3% in January. Gold rose 3.6% in January, Silver gained a similar 3.5%, but copper was off -2.4%. Oil had a very strong run in January, with Light Sweet Crude gaining 9.8%.
U.S. Economic News: Payroll processer ADP reported that the U.S. added a stronger-than-expected 234,000 private sector jobs last month, the second straight month of strong gains. The report showed that small private-sector businesses added 58,000 jobs in January, while medium-sized and large businesses added 91,000 and 85,000 jobs respectively. Mark Zandi, chief economist for Moody’s Analytics, said that the data showed that the labor market was “excruciatingly tight”. Zandi also predicted the unemployment rate would drop further from the current 4.1% rate into the mid 3% range.
The Labor Department reported the number of people who applied for new unemployment benefits last week fell by 1,000 to 230,000, still remaining near a 45-year low. Economists had expected claims to rise to 240,000. Over the past year, claims have fallen 8% and are near their lowest level since the early 1970’s. The tight job market is finally starting to benefit workers: wages for private-sector employees climbed 2.8% over the year ending in December, its biggest year-over-year gain since 2008.
The Labor Department’s monthly Non-Farm Payrolls (NFP) report showed the U.S. created 200,000 new jobs in the first month of 2018, indicating that companies are still anxious to hire new employees more than eight years after the economic expansion began. The increase in hiring exceeded analysts’ forecasts of 190,000 jobs. Unemployment remained at its 17-year low of 4.1%. Construction, education/health services, and leisure/hospitality led the industries for job creation. As has been reported numerous times, the biggest concern among businesses continues to be the ongoing shortage of skilled workers. Dan North, chief economist at Euler Hermes North America, says many manufacturers are now desperate enough to hire unskilled workers at low wages and train them.
Home prices surged to new highs in November according to the latest report from S&P CoreLogic Case-Shiller. S&P/Case-Shiller’s national home price index rose 6.2% on an annualized basis, while the more narrowly-focused 20-city index gained 6.4%. Prices nationally are now 6% higher than their 2006 peak, while those in the top 20 markets are still 1.1% below. The robust gains show that the lack of inventory in the housing market is not letting up, and neither is the rise in the price of homes. David M. Blitzer, Managing Director and Chairman of the Index Committee at S&P Dow Jones Indices stated, “Home prices continue to rise three times faster than the rate of inflation.” Blitzer cited the slow recovery in the home construction market as builders have yet to reach historically normal levels, despite the pent-up demand in the market. In the details of the report, Seattle and San Francisco continued to see the highest price gains, followed by San Diego, Los Angeles, and Las Vegas.
Pending home sales, which counts the number of homes in which a contract has been signed but not yet closed, also moved higher in December. The National Association of Realtors reported its pending home sales index rose 0.5% to its highest level since March. December marked the third consecutive increase for the index. Contract signings usually precede sales by 45 to 60 days, suggesting that the uptick in December means that 2018 should start the year with “a small trace of momentum.” Regionally, pending sales were mixed with sales down -5.1% in Northeast, down -0.3% in the Midwest, but up 2.6% in the South, and 1.5% in the West.
The Commerce Department reported that spending among the nation’s consumers hit a six-year high in December, climbing 0.4%. It was its biggest monthly increase since 2011. In the details of the release, incomes were up 0.4% in December and 3.1% for the full year. However, factoring in inflation, the gain was a much lesser 1.2% – the lowest inflation-adjusted reading since 2010. One item of concern, though: Americans reduce their savings rate to continue their purchasing. The savings rate fell to 2.4%, the lowest level since 2005. Greg Daco, chief U.S. economist at Oxford Economics said in a note to clients, “Looking ahead, we believe the Tax Cuts and Jobs Act will support stronger income growth in the first half of the year. This should help support the savings rate and continue to drive consumer outlays in 2018.” Americans increased spending in the final quarter of 2017 at the fastest pace in almost two years. The soaring stock market and strong labor market are giving households confidence to spend more money. Turning to inflation, the Federal Reserve’s preferred inflation measure, the Personal Consumption Expenditures Index rose a slight 0.1% in December. The “core” rate, which strips out the volatile food and energy categories, rose 0.2%. Overall, the rate of inflation over the past year slipped 0.1% to 1.7%, and the core rate remained flat at 1.5%.
Confidence among the nation’s consumers continued to strengthen, according to the Conference Board, with its index hitting a 17-year high of 125.4 last month. Economists had forecast a reading of 125. The Conference Board noted one area of uncertainty among consumers was the effect of recent tax cuts on their own incomes. Lower tax rates aren’t expected to show up in paychecks until the beginning of this month. Some have estimated that 90% of Americans could benefit from the tax cuts. In the details of the report, Americans are generally quite optimistic about the next six months with the index of future expectations rising 4.7 points to 105.5—near a 14-year high. However, the gauge of how Americans feel about the economy right now, the present situation index, slipped 1.2 points to 155.3 – but still just a few ticks below its 17-year high.
The Institute for Supply Management’s (ISM) manufacturing index retreated from a recent peak but remained strong last month. ISM’s manufacturing index slipped 0.2 to 59.1 last month, but that reading is still above the 57.4 average reading in all of 2017, and higher than the expected reading of 58.6. In the details, the numbers reveal a slight cooling off from the ultra-strong previous readings. The new orders sub-index dipped 2 points to 65.4, while the production sub-index ticked down -0.7 points to 64.5 and the employment sub-index fell to an eight-month low of 54.2. Of the 18 industry groups included in the survey, 14 reported expansion.
The Federal Reserve left its benchmark short-term interest rate unchanged at 1.25% to 1.5% in the first meeting of the year, a move (or non-move) that was widely expected. In addition, Chairwoman Janet Yellen stepped down and turned over the reins to Jerome Powell, Trump’s pick for new Fed Chair. The Fed continued to strongly hint that a rate hike is likely at its next meeting in March. The Fed made note that inflation is likely to hit its 2% target this year. Persistent low inflation has been the main stumbling block holding the Fed back from further rate hikes. “Inflation on a 12-month basis is expected to move up this year and to stabilize around the Committee’s 2 percent objective over the medium term,” the Fed wrote in its statement, adding that “further graduate increases” in interest rates are likely. The Fed projects three rate hikes this year.
International Economic News: Canada’s economy grew by 0.4% in November according to the latest data from Statistics Canada, matching economists’ expectations. Statistics Canada said 17 of 20 industrial sectors posted increases for the month, with the goods-producing sectors up 0.8% following a -0.5% decline in October. “November’s gain was mainly due to increases in the manufacturing and mining, quarrying and oil and gas extraction sectors, partly as a result of restoration in production capacity,” the federal government agency reported. The manufacturing sector was up 1.8% in November, marking its largest monthly increase since February 2014. Services-producing industries rose 0.3%, led by the real estate and rental and leasing, wholesale, and retail trade sectors. Toronto-Dominion Bank senior economist Brian DePratto said in a research note, “The Canadian economy fired on all cylinders in November: Production resumptions led the way, but nearly all major sectors reported gains on the month.”
Across the Atlantic, the head of the Bank of England Mark Carney continued to forecast headwinds for the British economy in its latest speech to the House of Lords. Mr. Carney had been criticized as being too pessimistic on the economy prior to the Brexit vote. Carney accepted that business investment had held up better than the bank predicted following the EU referendum, but he said areas of the economy were still not firing at rates that were consistent with world economic growth of 4%. Carney did not expect a “disorderly Brexit” to occur, but he stressed that Britain’s banks had sufficient capital reserves to cope with such an outcome should it occur.
In France, the economy expanded for its fifth consecutive quarter, delivering its best full year of performance since 2011. GDP rose 0.6% in the fourth quarter of last year, in line with forecasts. Capital investment rose 1.1%, while household spending increased 0.3% and net trade added to the bottom line. France’s economic revival comes following years of sluggish expansion and has been supported by French President Emmanuel Macron’s economic reforms and business tax cuts.
The German government sharply upped its economic outlook for 2018 projecting a growth rate of 2.4%, an increase of 0.5% over its previous estimate. Brigitte Zypries, the economy minister, said in Berlin the economy accelerated by 2.2% last year, primarily due to increasing domestic demand. It was its strongest performance for the last 6 years and the eighth consecutive year of economic growth. Some business leaders and economists have started to warn that Germany’s economy, the largest in the Eurozone, is in danger of overheating. The economy ministry addressed the concerns by noting, “Despite a slight capacity overutilization in some sections of the economy, in Germany, there is no overheating.”
China’s economy appears to be cooling again with a key reading of industrial activity falling to an eight-month low in January. China’s Purchasing Managers Index (PMI) indicated while activity was still in expansion, it was weaker than expected. The National Bureau of Statistics’ PMI declined 0.3 points to 51.3, remaining above the 50-point threshold that divides growth from contraction. However, the weaker reading was broad-based with key measures of output, imports, and new orders all showing declines and pointing to a weaker domestic economy. Capital Economics’ Julian Evans-Pritchard said the export order index looked particularly weak, “It fell to a 15-month low of 49.5, raising questions about the strength of foreign demand.”
In Japan, an average of 15 nongovernment think-tanks projected that Japanese real gross domestic product likely expanded for an eighth consecutive quarter for the first time since the 1980’s. The increase was driven by a pickup in consumer spending alongside solid exports and business investment. The average estimate of 0.8% was slower than the previous quarter’s 2.5% rise but in line with the roughly 1% level seen as the potential ongoing growth rate. If preliminary government data due out February 14 confirms predictions of an expansion, it would continue a run of positive growth that began in the first quarter of 2016. This would be the longest streak since a 12-quarter stretch that began in the second quarter of 1986, before the economic bubble of the late ’80s and early ’90s.
(sources: all index return data from Yahoo Finance; Reuters, Barron’s, Wall St Journal, Bloomberg.com, ft.com, guggenheimpartners.com, zerohedge.com, ritholtz.com, markit.com, financialpost.com, Eurostat, Statistics Canada, Yahoo! Finance, stocksandnews.com, marketwatch.com, wantchinatimes.com, BBC, 361capital.com, pensionpartners.com, cnbc.com, FactSet)
Indices mentioned are unmanaged and cannot be invested into directly. Past performance is no guarantee of future results. All Investing involves risk. Depending on the types of investments, there may be varying degrees of risk. Investors should be prepared to bear loss, including total loss of principal.