2-12-18 Market Update
2/12/18 Market Update
The very big picture:
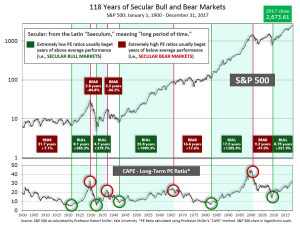
In the “decades” timeframe, the current Secular Bull Market could turn out to be among the shorter Secular Bull markets on record. This is because of the long-term valuation of the market which, after only eight years, has reached the upper end of its normal range.
The long-term valuation of the market is commonly measured by the Cyclically Adjusted Price to Earnings ratio, or “CAPE”, which smooths out shorter-term earnings swings in order to get a longer-term assessment of market valuation. A CAPE level of 30 is considered to be the upper end of the normal range, and the level at which further PE-ratio expansion comes to a halt (meaning that increases in market prices only occur in a general response to earnings increases, instead of rising “just because”).
Of course, a “mania” could come along and drive prices higher – much higher, even – and for some years to come. Manias occur when valuation no longer seems to matter, and caution is thrown completely to the wind as buyers rush in to buy first and ask questions later. Two manias in the last century – the 1920’s “Roaring Twenties” and the 1990’s “Tech Bubble” – show that the sky is the limit when common sense is overcome by a blind desire to buy. But, of course, the piper must be paid and the following decade or two are spent in Secular Bear Markets, giving most or all of the mania gains back.

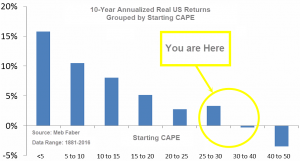
See Fig. 1 for the 100-year view of Secular Bulls and Bears. The CAPE is now at 31.69, down from the prior week’s 33.40, and still exceeds the level reached at the pre-crash high in October 2007. This value is at the lower end of the “mania” range. Since 1881, the average annual return for all ten year periods that began with a CAPE around this level has been in the 0% – 3%/yr. range. (see Fig. 2).

In the big picture:
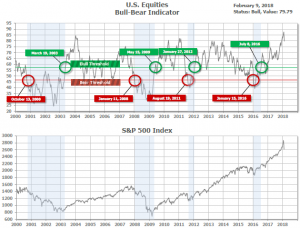
The “big picture” is the months-to-years timeframe – the timeframe in which Cyclical Bulls and Bears operate. The U.S. Bull-Bear Indicator (see Fig. 3) is in Cyclical Bull territory at 79.79, down from the prior week’s 84.22.

In the intermediate and Shorter-term picture:
The Shorter-term (weeks to months) Indicator (see Fig. 4) turned negative on February 5th. The indicator ended the week at 8, down sharply from the prior week’s 29. Separately, the Intermediate-term Quarterly Trend Indicator – based on domestic and international stock trend status at the start of each quarter – was positive entering January, indicating positive prospects for equities in the first quarter of 2018.

Timeframe summary:
In the Secular (years to decades) timeframe (Figs. 1 & 2), the long-term valuation of the market is simply too high to sustain rip-roaring multi-year returns – but the market has entered the low end of the “mania” range, and all bets are off in a mania. The only thing certain in a mania is that it will end badly…someday. The Bull-Bear Indicator (months to years) is positive (Fig. 3), indicating a potential uptrend in the longer timeframe. In the intermediate timeframe, the Quarterly Trend Indicator (months to quarters) is positive for Q1, and the shorter (weeks to months) timeframe (Fig. 4) is negative. Therefore, with internal disagreement expressed by two indicators being positive and one negative, the U.S. equity markets are rated as Neutral.
In the markets:
U.S. Markets: U.S. stocks suffered their worst weekly declines in two years as concern over rising interest rates and elevated equity valuations weighed on investors. However, a late day rally on Friday ended the week on a high note with the Dow closing higher by 330 points. For the week, the major benchmarks fell largely in tandem, and all of the major indexes entered “correction” territory (defined as a drop of more than 10% from their recent highs). The headlines focused on the Dow Jones Industrial Average’s twin 1000-point-plus declines on Monday and Thursday, the largest in its history. The Dow Jones Industrial Average ended the week at 24,190, down -5.2%. The technology-heavy NASDAQ Composite closed at 6,874, a decline of -5.1%. By market cap, small caps fared slightly better than large caps with the small-cap Russell 2000 giving up “only” -4.5%, while the large-cap S&P 500 lost -5.2% and the mid-cap S&P 400 fell -5.1%.
International Markets: It was a sea of red around the world. Canada’s TSX had its third consecutive loss for the week, falling -3.7%. The United Kingdom’s FTSE fell -4.7%, while on Europe’s mainland France’s CAC 40 and Germany’s DAX each fell -5.3%. In Asia, the sell-off was much more severe. China’s Shanghai Composite plunged -9.6%, while Japan’s Nikkei ended down -8.1%, and Hong Kong’s Hang Seng plummeted -9.5%. As grouped by Morgan Stanley Capital International, emerging markets lost -5.4%, while developed markets dropped an even deeper -5.5%.
Commodities: Precious metals aren’t exactly behaving like the “safe-haven” investments they’re often thought to be. Even with the recent volatility, gold actually traded down last week, losing -1.6% to end the week at $1315.70 an ounce. Silver fell a further -3.4% to end the week at $16.14. Energy plunged along with the major world equity indexes, with West Texas Intermediate crude oil falling a whopping -9.6% to $59.20 a barrel, and Brent crude falling -8.2% to $62.71. Copper, viewed by some analysts as an indicator of global economic health, fell for the fourth week in a row, dropping -4.8%.
U.S. Economic News: The number of Americans newly seeking unemployment benefits fell last week to 221,000, according to the Labor Department. First-time claims dropped to their lowest level in nearly 45 years as the labor market remained tight. Economists had expected claims to rise to 232,000. Last week marked the 153rd consecutive week that claims remained below the key 300,000 threshold that analysts use to indicate a healthy jobs market. That is the strongest stretch since 1970 when the labor market was much smaller. Overall, the labor market is near or at full employment, with the jobless rate at a 17 year low of 4.1%. The four-week moving average of claims, smoothed to iron out the weekly volatility, declined 10,000 to 224,500—its lowest level since March 1973.
The number of job openings in the U.S. fell slightly in December to a seven month low of 5.81 million, according to the Bureau of Labor Statistics’ monthly Job Openings and Labor Turnover Survey (JOLTS). Economists had expected 5.9 million openings. Companies hired 5.49 million people in December, while 5.24 million Americans lost their jobs. The ratio of unemployed persons per job opening maintained its current level of 1.1. Note that the ratio had peaked at 6.6 at the height of the financial crisis. The quit rate, which the Federal Reserve views as a positive as employees are presumably leaving jobs for better employment, ticked up 0.1% to 2.2%.
In the services sector, the Institute for Supply Management’s (ISM) services index surged last month to a 13-year high of 59.9, with employment activity setting a new record. Readings over 50 are viewed as positive for the economy, while analysts view readings over 55 as exceptionally strong. In the details of the ISM survey, the index that measures current staffing and future hiring rose 5.3 points to an all-time high of 61.6. That was its highest reading since the ISM services index began in 1997. In addition, the new orders index surged 8.2 points to 62.7—its highest since 2011. Fifteen out of the seventeen industries tracked in the ISM report said their businesses expanded in January. Overall, the U.S. economy has gotten off to a good start to the new year. Consumers continue to spend, incomes are rising, and companies are investing more. The services sector is particularly important, as it employs eight out of ten American workers.
Consumer borrowing remained strong in December, although slightly slower than the previous month, according to the Federal Reserve. Total consumer credit increased $18.4 billion to a seasonally-adjusted record $3.84 trillion—an annual growth rate of 5.8%. This was down from the revised $31 billion in the prior month. Economists had expected a $20 billion increase. Revolving credit, such as credit cards, rose 6% in December to $1.03 trillion—the highest on record. Non-revolving credit, typically student and auto loans, rose by 5.7% following an 8.6% rise in November. In the fourth quarter, consumer credit rose at a 7.7% annual rate, its strongest quarter of the year. However, for all of 2017, consumer credit was up 5.4%, a -1.3% decrease from 2016.
Jerome Powell officially took the helm of the Federal Reserve this week, as outgoing Fed Chair Janet Yellen announced she would be joining the Brookings Institute. Powell was sworn in Monday and introduced himself to the country in a video posted on the Federal Reserve’s website. In his statement, Powell stated his leadership would be one of transparency where the Fed would explain “what we are doing and why we are doing it.” Powell addressed the recent positive economic performance, stressing that unemployment and inflation are low and the economy continues to grow. “Through our decisions on monetary policy, we will support continued economic growth, a healthy job market, and price stability,” Powell said.
St. Louis Fed President James Bullard said this week that he didn’t think the strong U.S. labor market necessarily means that higher inflation is just around the corner, seemingly directed at analysts who view the fear of inflation as one of the main reasons for the broad market sell-off this past week. In a speech at the University of Kentucky’s Gatton College of Business and Economics, Bullard said that higher wages were not a key driver of inflation. “The empirical relationship between these variables [wages and inflation] has broken down in recent years and may be close to zero,” he added. While the Fed has indicated it anticipates three interest rate hikes for this year, Bullard has advocated for the Fed to hold interest rates steady through 2020.
International Economic News: The Canadian economy lost jobs for the first time in a year and a half last month, putting an end to the strong run that added 423,000 jobs last year. According to Statistics Canada, the country lost 88,000 jobs last month, following a gain of 64,800 in December. The unemployment rate, which ended 2017 at its lowest level since comparable data began in 1976, rose slightly to 5.9% – a bit higher than expected. The declines were led by a drop in part-time hiring and were concentrated in the construction, financial services, educational, and scientific sectors. The report is the first major economic report that indicates what economists and policymakers have been cautioning about—that the pace of growth in 2017 is likely to slow this year. If weak jobs growth continues, it could prompt policymakers to rethink their pace of monetary tightening.
The Bank of England is cautioning Britons to get ready for rate hikes based on upgraded growth forecasts. The Bank of England left interest rates unchanged at 0.5% at its meeting this week, as expected, however, the bank signaled that interest rates could now rise faster and to a greater extent than previously expected. Governor Mark Carney stated, “It will likely be necessary to raise interest rates to a limited degree in a gradual process, but somewhat earlier and to a somewhat greater extent than what we had thought in November.” Alongside its monetary policy decision, the bank released its Quarterly Inflation Report that upgraded its forecasts for UK economic growth in both 2018 and 2019. The Bank of England now expects UK GDP to expand by 1.7% in 2018, compared to a previous forecast of 1.5% made in November. Growth in 2019 is expected to be 1.8%, compared to a previous forecast of 1.7%.
In France, as its economy continues to improve, there is a new problem—a shortage of labor. It comes as somewhat of a surprise as France’s stubbornly high unemployment rate stands at 9.4%. The reason for the simultaneous high unemployment and lack of workers is a massive skills mismatch. Like many developed economies, France is lacking the number of skilled workers it now needs. More than a third of French manufacturing companies are operating at full capacity—its highest level since 1990, while 40% report difficulty recruiting workers, according to French statistics agency INSEE. President Macron’s government outlined plans on Friday to make apprenticeships much more common, a move companies say is desperately needed.
The German national statistics office Destatis reported the country posted record exports and imports for 2017. Germany exported goods worth $1.571 trillion and imported goods worth 1.034 trillion euro last year. The numbers were all-time records for both, with shipments abroad rising 6.3% and imports picking up by 8.3%. The foreign trade balance showed a surplus of 244.9 billion euro, down from the 248.9 billion euro surplus the previous year. Germany has been under significant pressure from its trading partners to reduce its trade surplus, but not all were satisfied. ING Diba analyst Carsten Brzeski noted, “The reduction of the trade imbalance is far too little; I expect the country will still have extremely high trade and current account surpluses in 2018.”
In Asia, China’s international trade situation improved last month after weakness in December. Exports and imports both grew much more than expected, according to official data, suggesting that global demand had a strong start to the new year. Exports rose 11.1% from the same time last year, rising 0.2% from December, while imports surged almost 37%. Imports rose at their fastest pace since February of last year and blew away analysts’ forecast of a 9.8% increase. Commodities led the way with crude oil imports hitting a record high, and iron ore at their second highest on record. The new data left the country with its smallest trade surplus in almost a year at “just” $20.34 billion. However, analysts caution that data from China in the first two months of the year must always be taken with a grain of salt due to distortions caused by the Lunar New Year holidays. Nonetheless, Louis Kuijs, head of Asia economics at Oxford Economics said in a note, “such strong import data indicates that domestic demand momentum remains healthy going into 2018.”
The Japanese government has decided to nominate Haruhiko Kuroda to serve as governor of the Bank of Japan for another term after his current term expires in April. The decision is viewed as a sign that Japan’s ultra-loose monetary policy is likely to continue. The reappointment means the BOJ will likely stick to its policy of capping borrowing costs around zero. The nomination was widely taken as a positive for Japan’s economy and the larger global economy. Stefan Gerlach, chief economist at Swiss bank EFG stated it was a good sign and that “it means there is policy continuity and obviously it is good to have someone who is respected by the government enough to be reappointed.” Kuroda has stressed his resolve to keep monetary liquidity from the Bank of Japan wide open to achieve the bank’s inflation target, a sign the BOJ will maintain its massive stimulus program even as other central banks move towards ending crisis-mode stimulus.
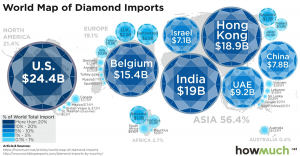
Finally: With Valentine’s Day coming up this week, more than a few diamonds will be given to sweethearts, lovers, and spouses. The diamond trade is global, but the major diamond importers may surprise those not “in the business”. The chart below, from howmuch.net, visualizes the relative size of diamond imports by country and further grouped by region. In the case of the U.S., almost all of the diamond imports are for consumption, whereas Belgium and Israel are major diamond processing centers, with subsequent exports of the majority of their imports. Hong Kong, a very small, very wealthy Chinese island protectorate, represents a disproportionately large amount of diamond imports. Upon closer inspection, however, most of the Hong Kong diamonds are moved to the nearby Shenzhen province in mainland China for use in jewelry manufacturing and then moved back to Hong Kong for subsequent export. If Hong Kong and China were combined, their total would be larger than any other diamond importer on the globe.

(sources: all index return data from Yahoo Finance; Reuters, Barron’s, Wall St Journal, Bloomberg.com, ft.com, guggenheimpartners.com, zerohedge.com, ritholtz.com, markit.com, financialpost.com, Eurostat, Statistics Canada, Yahoo! Finance, stocksandnews.com, marketwatch.com, wantchinatimes.com, BBC, 361capital.com, pensionpartners.com, cnbc.com, FactSet)
Indices mentioned are unmanaged and cannot be invested into directly. Past performance is no guarantee of future results. All Investing involves risk. Depending on the types of investments, there may be varying degrees of risk. Investors should be prepared to bear loss, including total loss of principal.
