
1/29/2018 Market Update
1/29/2018 Market Update
The very big picture:
In the “decades” timeframe, the current Secular Bull Market could turn out to be among the shorter Secular Bull markets on record. This is because of the long-term valuation of the market which, after only eight years, has reached the upper end of its normal range.
The long-term valuation of the market is commonly measured by the Cyclically Adjusted Price to Earnings ratio, or “CAPE”, which smooths out shorter-term earnings swings in order to get a longer-term assessment of market valuation. A CAPE level of 30 is considered to be the upper end of the normal range, and the level at which further PE-ratio expansion comes to a halt (meaning that increases in market prices only occur in a general response to earnings increases, instead of rising “just because”).
Of course, a “mania” could come along and drive prices higher – much higher, even – and for some years to come. Manias occur when valuation no longer seems to matter, and caution is thrown completely to the wind as buyers rush in to buy first and ask questions later. Two manias in the last century – the 1920’s “Roaring Twenties” and the 1990’s “Tech Bubble” – show that the sky is the limit when common sense is overcome by a blind desire to buy. But, of course, the piper must be paid and the following decade or two are spent in Secular Bear Markets, giving most or all of the mania gains back.
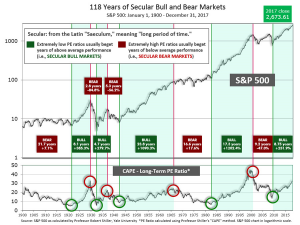
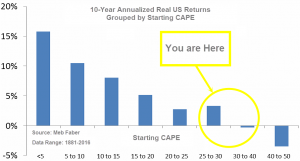
See Fig. 1 for the 100-year view of Secular Bulls and Bears. The CAPE is now at 34.75, up from the prior week’s 33.90, and exceeds the level reached at the pre-crash high in October 2007. This value is at the lower end of the “mania” range. Since 1881, the average annual return for all ten year periods that began with a CAPE around this level have been in the 0% – 3%/yr. range. (see Fig. 2).
In the big picture:
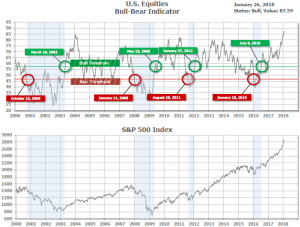
The “big picture” is the months-to-years timeframe – the timeframe in which Cyclical Bulls and Bears operate. The U.S. Bull-Bear Indicator (see Fig. 3) is in Cyclical Bull territory at 87.59, up from the prior week’s 86.29.
In the intermediate and Shorter-term picture:
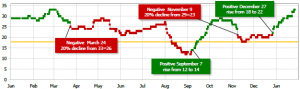
The Shorter-term (weeks to months) Indicator (see Fig. 4) turned positive on December 27th. The indicator ended the week at 33, up from the prior week’s 30. Separately, the Intermediate-term Quarterly Trend Indicator – based on domestic and international stock trend status at the start of each quarter – was positive entering January, indicating positive prospects for equities in the first quarter of 2018.
Timeframe summary:
In the Secular (years to decades) timeframe (Figs. 1 & 2), the long-term valuation of the market is simply too high to sustain rip-roaring multi-year returns – but the market has entered the low end of the “mania” range, and all bets are off in a mania. The only thing certain in a mania is that it will end badly…someday. The Bull-Bear Indicator (months to years) is positive (Fig. 3), indicating a potential uptrend in the longer timeframe. In the intermediate timeframe, the Quarterly Trend Indicator (months to quarters) is positive for Q1, and the shorter (weeks to months) timeframe (Fig. 4) is also positive. Therefore, with internal unanimity expressed by all three indicators being positive, the U.S. equity markets are rated as Positive.
In the markets:
U.S. Markets: Stocks continued their New Year’s winning streak with the major indexes hitting new record highs and notching their fourth consecutive weekly gains. Large-cap indexes outperformed their smaller cap brethren, as fourth quarter earnings results from companies representing nearly one-fifth of the S&P 500’s market capitalization reported results last week. The Dow Jones Industrial Average added 2.1% to last week’s gain to close at a new record high of 26,616. The technology-heavy NASDAQ Composite rose 169 points, or 2.3%, to close at 7,505, also a record high. The large-cap S&P 500 surged 2.2%, while the S&P 400 midcap index added 0.8% and the small-cap Russell 2000 index added “just” 0.65%.
International Markets: Canada’s TSX reversed last week’s gain, falling -0.7%. In Europe, the United Kingdom’s FTSE had its second consecutive down week, losing -0.80%. On Europe’s mainland, major markets were mixed. France’s CAC 40 rose just 0.05%, Germany’s DAX fell -0.70%, and Italy’s Milan FTSE added 0.45%. In Asia, China’s Shanghai Composite followed last week’s strong gain with a 2% rise. Japan’s Nikkei fell -0.74%, while Hong Kong’s Hang Seng index surged 2.8%–its seventh consecutive weekly gain.
Commodities: Energy led the way as West Texas Intermediate crude oil rose 4.5% to $66.14 per barrel, along with Brent crude which rose 2.5% to $70.35 per barrel. Precious metals were also bid higher with Gold rising 1.4% to end the week at $1,352.10 per ounce. Silver, which often trades similarly to gold but with more volatility, added 2.4% to close at $17.44 an ounce. Copper, which some analysts watch as an indicator of global economic health due to its variety of uses, rose 0.4% last week.
U.S. Economic News: Initial claims for unemployment benefits bounced higher from last week’s 45-year low. Jobless claims rose 17,000 to 233,000 last week, below the 240,000 that economists’ had forecast. The less-volatile monthly average of claims fell 3,500 to 240,000. Analysts note that claims tend to be volatile in January due to the winter weather, the Christmas and New Year’s holidays, and the end of the Christmas shopping season, when many companies add – and then drop – temporary employees. Layoffs continue to remain extremely low as well as the unemployment rate.
The National Association of Realtors (NAR) reported that the sales of existing homes fell 3.6% to a 5.57 million seasonally-adjusted annual rate in December, missing expectations of 5.73 million. The cause was attributed to the shrinking supply of homes available for sale. Still, home sales were up 1.1% when compared to the same time last year. Sales of existing homes for 2017 were their best since 2006. In December, inventory dropped 11.4% on a monthly basis, the 31st consecutive month in which supply was lower when compared with the same time in the prior year. At the current sales rate, there is just a 3.2 months’ supply of homes available, the lowest level since the NAR began tracking it in 1999. The shortage pushed prices higher. The median sales price for an existing home last month was $246,800, a 5.8% increase from the same time last year. First-time buyers made up 32% of all transactions in December, up 3% from November.
Sales of new homes also slipped in December, but for the entire year of 2017 sales were up 8.3% compared to 2016. According to the Commerce Department, new home sales were at a 625,000 seasonally-adjusted annual rate in December, missing economists’ forecasts of a 680,000 annual rate. Analysts were quick to point out that the government’s data on new home construction is often erratic and heavily revised. For new homes, the median price of houses sold in December was $335,400—2.5% higher than the same time a year earlier. At its current sales pace, it would take 5.7 months to exhaust the available inventory—a level indicative of a very healthy housing market.
In the Windy City, the Chicago Federal Reserve’s index of national economic activity rose in December primarily due to strength in the nation’s manufacturing sector. The index rose to 0.15 last month, up 0.04 point from November. The index is a weighted average of 85 economic indicators designed so that above-zero readings represent trend growth, and a three-month average below -0.7 suggests a recession has begun. Out of the 85 indicators, just over half made positive contributions to the reading. The biggest contributor to the index was a large contribution from the factory sector, which improved to 0.25 from -0.02. Of concern, however, the employment index, personal consumption, and housing all weakened. The index’s less-volatile three-month moving average was 0.23 last month, a 0.03 decline from November.
The Chicago Fed’s data is supported by research firm IHS Markit’s Purchasing Managers Index (PMI) survey. The PMI reported manufacturers in the U.S. witnessed a solid start to 2018. The survey showed that production volumes and new orders experienced robust growth. In addition, strong export growth supported manufacturers as well. The Manufacturing-subset PMI increased 0.4 points to 55.5 points in January. Readings over 50 indicate expansion. Chris Williamson, chief business economist at IHS Markit, said, “January saw an encouraging start to the year for the US economy. Business activity across the manufacturing and service sectors continued to expand, driving further job gains as companies expanded capacity. Manufacturing is faring especially well, in part thanks to the weaker dollar, providing an important spur to the economy at the start of the year.”
The Commerce Department reported that durable goods, manufactured goods intended to last longer than 3 years, accelerated 2.9% last month, led by higher demand for airplanes and autos. Economists had only expected a gain of 0.9%. Ex-transportation, orders rose a lesser 0.6%. Large commercial aircraft were responsible for the bulk of the gain, with orders rising almost 16%. Auto orders were up 0.4%. Core capital goods orders, which remove defense and aircraft spending, slipped a slight 0.3%. Still, core capital goods orders are up 8.4% from the same time last year.
The Conference Board reported that its Leading Economic Indicators Index (LEI) shows that the U.S. economy is primed for a healthy start to 2018. The LEI jumped 0.6% in December, its third straight increase. In the details, the measure of current economic conditions rose 0.3% in December, while a “lagging” index that looks back over the recent past rose 0.7%. Adding to the index’s reading were the rising stocks market, rising business orders, and higher consumer confidence. Ataman Ozyildirim, director of business cycles research at the Conference Board stated, “The U.S. LEI continued rising rapidly in December, pointing to a continuation of strong economic growth in the first half of 2018. The passing of the tax plan is likely to provide even more tailwind to the current expansion.”
The U.S. economy was strong at the end of last year, but inventories and trade weighed on the economy. The nation’s Gross Domestic Product for the fourth quarter came in at 2.6%, missing economists’ forecasts of 3%. For the full year, the U.S. economy expanded at 2.3%, exceeding 2016’s growth by 0.7%. Supporting GDP growth was consumer spending which grew at a 3.8% annual pace (its fastest in almost two years) and equipment spending by businesses which grew by 11.4%. However, weighing on GDP was a fall in the value of unsold goods/inventories. But even that might not be bad news as companies may have sold more goods than expected during the holiday season causing inventories to drop. The only clear negative was the bigger trade deficit. Imports rose 13.9%, predominantly due to higher oil prices, while exports rose just 6.9%.
International Economic News: The International Monetary Fund (IMF) raised its economic growth forecast for Canada. The IMF said Canada’s economy is expected to grow by 2.3% in 2018, and 2% in 2019, an increase of 0.2% and 0.3% from its previous forecast. The higher expectations are due to recent tax reforms in the United States that are expected to increase demand in all of North America. The IMF noted that it still considers uncertainty with the outcome of NAFTA negotiations as a risk to the Canadian economy.
When the British electorate voted to leave the EU in June 2016, many so-called economic experts and well-regarded global think tanks forecasted absolute economic doom for the country. And while some short-term volatility following the vote did indeed occur, overall the UK’s economic expansion remained intact. In fact, the UK economy expanded by a better-than-expected 0.5% in the final quarter of 2017. The reading brought the overall total economic growth for the year to 1.8%. The UK’s Office for National Statistics (ONS) reported the services sector, which accounts for the bulk of the economy, expanded by 0.6%. However, when compared to the same quarter a year ago, the ONS said that services showed a “weakening, particularly in the more domestic consumer-facing type sectors”, such as hotels, catering, transport, and storage and communications.
Economic confidence among French citizens remained strong but slipped from a 10-year high in its latest reading. French statistics agency Insee reported its business climate indicator slipped two points this month from December’s 10-year high but remained well above the long-term average of 100. The employment indicator remained steady at 109, its healthiest level since August 2011. The strong employment environment was reflected among households where fears about unemployment declined over the past month. Consumers views of their living standards also improved, but the overall consumer confidence indicator slipped due to a slight increase in worries about households’ future financial situations.
In Germany, confidence among the nation’s businesses rebounded in January back to November’s record high, according to the Munich-based Ifo economic institute. The reading suggests that Europe’s biggest economy continued to fire on all cylinders at the beginning of the year, despite a stronger euro. Ifo’s business climate index rose 0.4 points to 117.6 this month, beating analyst expectations of a dip to 117.1. The surprisingly positive reading bodes well for Germany’s continued growth and will likely give Chancellor Angela Merkel support as she tries again to form a coalition government.
Two of the weaker nations in the European Union are the ones being hardest hit by the influx of migrants from Africa. At the World Economic Forum in Davos, the Prime Ministers of Italy and Greece delivered a forceful presentation that EU members must share migrants and refugees rather than expecting the Mediterranean nations to deal with the influx alone. Richer nations should also address the root cause of the migrant crisis by committing to a major development aid program in the form of a Marshal Plan for Africa, said Italy’s Paolo Gentiloni and Greece’s Alexis Tsipras.
The Chinese economy started the year on a solid trajectory, despite slowing industrial profits. Data released this week showed that momentum remains intact with sales managers the most upbeat since last summer, financial experts being more optimistic, and satellite imagery suggesting that manufacturing conditions are improving for the first time in four months. Xia Le, chief Asia economist at Banco Bilbao Vizcaya Argentaria SA in Hong Kong stated, “The strong momentum will likely be carried over to the first quarter, with the economy being supported by strong external demand and domestic consumption.” This transition was echoed by Chinese President Xi Jinping’s chief economic adviser Liu He, who told political and financial elites in Davos that China is moving to upgrade its output rather than just hit numerical targets.
Japanese inflation continued to perplexingly lag the strong economic revival seen in the island nation, leaving the central bank in a quandary on how to turn off some of the crisis-era stimulus policies that some of its board members warn will harm the economy if retained for too long. Adding to the concern is the recent rise in the value of Japan’s yen currency, which makes it even harder to stave off the deflation that has weighed on Japan’s economy for decades. Government data released on Friday gave little hope on the inflation front, with core prices last month rising just 0.9% year-over-year, unchanged from November. That was well below the Bank of Japan’s 2% price target and supported maintaining its ultra-easy monetary policy for now even as other central banks start to wind back.
Finally: It’s no secret that pharmaceuticals and healthcare are big business in the global economy. Last year alone, drugs and medicine made up over $318 billion of world exports—but where do all those pills, serums, and creams come from? It might surprise most Americans that the good ol’ US of A is a distant fifth in pharmaceutical exports, behind Switzerland, Germany, Belgium, and France. At least it is comforting that the two countries most respected for quality and precision manufacturing – Switzerland and Germany – are atop the leader board in this industry where those characteristics are literally of life and death importance! (Chart source: www.howmuch.net)

(sources: all index return data from Yahoo Finance; Reuters, Barron’s, Wall St Journal, Bloomberg.com, ft.com, guggenheimpartners.com, zerohedge.com, ritholtz.com, markit.com, financialpost.com, Eurostat, Statistics Canada, Yahoo! Finance, stocksandnews.com, marketwatch.com, wantchinatimes.com, BBC, 361capital.com, pensionpartners.com, cnbc.com, FactSet)
Indices mentioned are unmanaged and cannot be invested into directly. Past performance is no guarantee of future results. All Investing involves risk. Depending on the types of investments, there may be varying degrees of risk. Investors should be prepared to bear loss, including total loss of principal.