
2-4-19 Weekly Market Update
The very big picture:
In the “decades” timeframe, the current Secular Bull Market could turn out to be among the shorter Secular Bull markets on record. This is because of the long-term valuation of the market which, after nine years, has reached the upper end of its normal range.
The long-term valuation of the market is commonly measured by the Cyclically Adjusted Price to Earnings ratio, or “CAPE”, which smooths out shorter-term earnings swings in order to get a longer-term assessment of market valuation. A CAPE level of 30 is considered to be the upper end of the normal range, and the level at which further PE-ratio expansion comes to a halt (meaning that increases in market prices only occur in a general response to earnings increases, instead of rising “just because”).
Of course, a “mania” could come along and drive prices higher – much higher, even – and for some years to come. Manias occur when valuation no longer seems to matter, and caution is thrown completely to the wind as buyers rush in to buy first and ask questions later. Two manias in the last century – the 1920’s “Roaring Twenties” and the 1990’s “Tech Bubble” – show that the sky is the limit when common sense is overcome by a blind desire to buy. But, of course, the piper must be paid and the following decade or two are spent in Secular Bear Markets, giving most or all of the mania gains back.

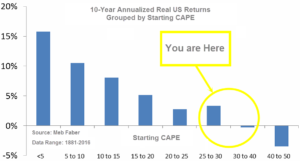
See Fig. 1 for the 100-year view of Secular Bulls and Bears. The CAPE is now at 29.75, up from the prior week’s 29.28, about the level reached at the pre-crash high in October, 2007. Since 1881, the average annual return for all ten year periods that began with a CAPE around this level have been in the 0% – 3%/yr. range. (see Fig. 2).
In the big picture:
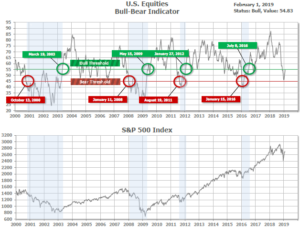
The “big picture” is the months-to-years timeframe – the timeframe in which Cyclical Bulls and Bears operate. The U.S. Bull-Bear Indicator (see Fig. 3) is in Cyclical Bull territory at 54.83, up from the prior week’s 52.46.
In the intermediate and Shorter-term picture:
The Shorter-term (weeks to months) Indicator (see Fig. 4) turned positive on November 28th. The indicator ended the week at 34, up sharply from the prior week’s 27. Separately, the Intermediate-term Quarterly Trend Indicator – based on domestic and international stock trend status at the start of each quarter – was negative entering January, indicating negative prospects for equities in the first quarter of 2019.

Timeframe summary:
In the Secular (years to decades) timeframe (Figs. 1 & 2), the long-term valuation of the market is simply too high to sustain rip-roaring multi-year returns. The Bull-Bear Indicator (months to years) remains positive (Fig. 3), indicating a potential uptrend in the longer timeframe. In the intermediate timeframe, the Quarterly Trend Indicator (months to quarters) is negative for Q1, and the shorter (weeks to months) timeframe (Fig. 4) is positive. Therefore, with two indicators positive and one negative, the U.S. equity markets are rated as Neutral.
In the markets:
U.S. Markets: U.S. stocks finished the week notably higher due to strong rallies on Wednesday and Thursday. In a widely expected move, the Federal Reserve decided to keep rates steady, but investors were cheered by an unexpectedly dovish post-meeting statement. The Dow Jones Industrial Average rose 326 points to close at 25,063—a gain of 1.3%. The technology-heavy NASDAQ Composite added 1.4% finishing the week at 7,263. By market cap, the large cap S&P 500 rose 1.6%, while the mid cap S&P 400 and small cap Russell 2000 each rose 1.3%.
International Markets: Canada’s TSX rose 0.9% for the week. Across the Atlantic, the United Kingdom’s FTSE retraced last week’s entire decline by finishing up 3.1%. On Europe’s mainland, however, major markets were mixed. France’s CAC 40 rose 1.9%, while Germany’s DAX ended down -0.9%. In Asia, China’s Shanghai Composite added 0.6% and Japan’s Nikkei ticked up 0.1%. As grouped by Morgan Stanley Capital International, emerging markets rose 1.3%, while developed markets gained 0.8%.
Commodities: Precious metals had their second week of good gains as gold rose 1.9%, closing at $1322.10 an ounce. Silver rose 1.5% and finished the week at $15.93 per ounce. Crude oil resumed its rally after taking a break last week. Crude oil finished up 2.9% at $55.26 per barrel for West Texas Intermediate crude. The industrial metal copper, seen as a gauge of world economic health due to its variety of uses, rose 1.6%.
January Summary: For the month of January, the Dow Jones Industrial Average and NASDAQ Composite smartly rose by 7.2% and 9.7% respectively. Smaller cap indexes outperformed their large cap peers as the S&P 400 and Russell 2000 shot up 10.4% and 11.2%, while the large cap S&P 500 gained a lesser but still robust 7.9%. Canada’s TSX surged 8.5%, but outside of North America major market gains were less robust. The United Kingdom’s FTSE rose 3.6%. France’s CAC 40 and Germany’s DAX added 5.5% and 5.8%, respectively. China’s Shanghai Composite rose 3.6% and Japan’s Nikkei gained 3.8%. Developed markets rebounded 6.6%, while emerging markets surged 10.3%. Gold and silver each gained 3.4%, while copper added 2.9%. However, the big story in commodities was in energy, where oil rallied 18.5%.
U.S. Economic News: Initial claims for new unemployment benefits surged by 53,000 last week to 253,000, far above the consensus of a 16,000 increase. It was the biggest jump and to the highest level since September 2017. The number was likely influenced by filings from federal contractors and others impacted by the government shutdown. If this is the case, then initial claims should subside in the coming weeks. The four-week average of claims, used to reduce the short-term volatility, rose by 5,000 to 220,250. That number remains close to multi-decade lows and is consistent with tight labor market conditions.
The U.S. added 304,000 jobs in January as firms continue to hire at a robust rate despite global headwinds, according to the Bureau of Labor Statistics. The reading was the biggest increase in almost a year and blew away expectations for a modest gain of 172,000 nonfarm jobs. The economy has added an average of 241,000 jobs a month over the last three months, one of its best stretches in the nearly 10-year old economic expansion. Meanwhile, the unemployment rate ticked up to 4%. The Labor Department said the government shutdown did contribute to the higher jobless rate, but it had “no discernable impacts” on the surge in hiring last month.
The private sector added 213,000 new jobs in January according to payrolls-processor ADP. The reading soared past consensus expectations for a gain of 183,000. Goods-producing payrolls jumped by 68,000, the most in nearly a year and manufacturing added over 33,000 new jobs matching its biggest increase since March of 2012. Services industries added 145,000 new positions with notable gains in professional and business services, health care, and leisure and hospitality. By size, big companies added 66,000 new jobs, mid-size filled 84,000 new positions, and small businesses increased employment by 63,000.
Existing home prices continued to moderate, according to the S&P CoreLogic Case-Shiller National Home Price Index. The 20-city index rose a seasonally-adjusted 0.3% in November and was up 4.7% compared to the same time last year. However, that reading missed estimates for a 4.9% yearly increase and was the slowest pace of annual growth since January of 2015. In November, the metro areas with the biggest annual gains were Las Vegas, Phoenix, and Seattle, however on a monthly basis some of the biggest losers were cities where prices had surged—Denver, San Francisco, and also Seattle. David Blitzer, chairman of the Index Committee at S&P Dow Jones noted “higher prices and increased mortgage rates” were weighing on home prices.
Pending home sales, which measures housing activity in which a contract has been signed but not yet closed, fell 2.2% in December and is down 9.8% from the same time last year. The National Association of Realtors (NAR) noted that higher mortgage rates in the last months of 2018, high prices, and low affordability, all weighed on contract signings. However, as mortgage rates have now backed down, the NAR notes realtors are “confident that the housing market will see improvement in 2019.” Indeed, the conventional mortgage rate is now back below 4.5%, down from nearly 5% in November.
A broad measure of the U.S. economy, the Chicago Fed’s National Activity Index (CFNAI), was up slightly in December, but overall fourth quarter activity was notably weaker than the third. The CFNAI ticked up 0.06 points in December to 0.27, but the volatile nature of the monthly data puts emphasis on the index’s three-month average. The CFNAI’s three-month average increased 0.04 point to 0.16 in the final quarter of 2018, but that was down significantly from the Q3 average of 0.31. Factory-activity and employment-related indicators were responsible for much of the gain. The Chicago Fed index is a weighted average of 85 economic indicators, designed so that zero represents trend growth and a three-month average above 0.70 suggests an increasing likelihood of a period of sustained increasing inflation. Forty-six of the 85 individual indicators made positive contributions in December, while 39 made negative contributions.
Confidence among the nation’s consumers continued to decline last month amid increased financial market volatility and the government shutdown. The Consumer Confidence Index fell 6.4 points to 120.2—its third consecutive decline and its lowest level since July of 2017. Expectations were for only a 4.1 point decline. While consumers’ attitudes towards their present situation remained steady, their expectations of the future plunged 10.4 points to 87.3—its lowest reading since October of 2016. In addition, the outlook for business conditions was its weakest since November of 2013. However, with the shutdown now over and equity prices recovering many analysts expect confidence to rebound next month. Lynn Franco, director of economic indicators at the Conference Board observed, “Shock events such as government shutdowns tend to have sharp, but temporary, impacts on consumer confidence.”
Federal Reserve Chairman Jerome Powell thrilled markets this week when he said the case for higher interest rates “has weakened” because of muted inflation and somewhat slower economic growth and stressed that the central bank will be “patient” before determining its next move. The Fed also indicated it’s willing to adjust the size and scale of its balance-sheet runoff, and perhaps end it altogether. In a unanimous 10-0 vote, senior Fed officials left the key U.S. Fed Funds interest rate, unchanged stating that the current level of interest rates is “appropriate for the state of the economy”. The central bank also backed away from prior pledges for “further gradual increases” in interest rates — the first time since 2015 that the Fed’s statement has not included such language.
International Economic News: Statistics Canada reported the Canadian economy likely shrank in November adding to evidence that growth likely slowed in the final quarter of 2018. A combination of dropping oil prices, U.S.-China trade tensions, equity market volatility, and repercussions from the Bank of Canada’s fifth interest rate hike in late October all weighed on the economy, economists stated. Earlier, Statistics Canada had reported that wholesale trade fell 1%, manufacturing sales declined 1.4%, and retail sales had dropped 0.9%. The Bank of Canada now forecasts 1.3% growth in the fourth quarter; however, Benjamin Reitzes, macro strategist at BMO Capital Markets, marked his forecast down to 1.2% growth. “The uncertainty surrounding housing, trade and oil will take at least a few months to clear up” Reitzes said in his research note.
The risk of gridlock on the border due to the potential of a “no-deal Brexit” has led British manufacturers to ramp up stockpiling of raw materials to their highest levels on record for a major advanced economy. According to research firm IHS Markit and the Chartered Institute of Procurement and Supply, British factories raised their stocks at the fastest pace since records began in the early 1990’s. In addition, the rush to stock raw materials, components, and finished goods with less than 60 days before the Brexit deadline marked the highest level of stockpiling activity for a G7 nation since comparable records began in 2007. James Knightley, chief international economist at the City bank ING, said: “Manufacturing is so reliant on complex supply chains that precautionary inventory building is a necessity.”
Despite violent anti-government protests, France ended 2018 with stronger economic growth than expected. In a much needed development for French President Emmanuel Macron, gross domestic product rose 0.3% in the final quarter of 2018 according to French statistics agency Insee. The figure was above economists’ forecasts of 0.1% growth. The French central bank had cut its growth forecasts for the fourth quarter to 0.2% because of the gilets jaunes, or yellow vest, protests. Economists stated rising exports had offset stagnant household consumption to boost the economy. The fourth quarter result meant that French economic growth hit 1.5% in 2018, below the government’s original forecast of 1.7% and well below 2017’s decade high growth rate of 2.3%.
German Economy Minister Peter Altmaier forecast only 1% growth for Germany this year due to the risks of Brexit and rising global trade tensions. Previously, Berlin had estimated 1.8% growth for 2019. Heading into 2019, Germany faces its lowest economic growth since 2013. According to an initial estimate supplied by Federal Statistics Office, Germany grew 1.5% in 2018. That compares to growth of 2.2% in each of the previous two years. Altmaier said the risks had risen primarily in what he described as the “external economic field,” such as an uncertain Brexit outcome and trade conflicts — especially with the United States. On Brexit, Altmaier said he was deeply worried that a British exit from the EU at the end of March would lead to “considerable economic policy distortions.” Berlin must do everything in the coming days to help avoid an unregulated Brexit, he added.
China’s manufacturing activity shrank a second consecutive month in January, adding to fears of an impending global economic slowdown. China’s official manufacturing Purchasing Managers’ Index (PMI) for January was 49.5 according to the National Bureau of Statistics. While the reading was higher than the previous month and exceeded expectations, it still indicated contraction (sub-50 values = contraction). Meanwhile, China’s services PMI for January came in at 54.7, a 3.9-point improvement over December. In addition, data released by China’s National Bureau of Statistics for the last quarter of 2018 showed annual growth of just 6.4% – a 28-year low.
The Economic Partnership Agreement (EPA) between the European Union and Japan took effect this week, allowing businesses and consumers across Europe and Japan to take advantage of the largest open trade zone. The EPA removes the vast majority of one billion (euro) duties paid annually by EU companies exporting to Japan. Once the agreement is fully adopted, Japan will have eliminated customs duties on 97% of goods imported from the European Union. The agreement also removes a number of long-standing non-tariff barriers, such as international standards for cars. It will also break down barriers for EU food and drink exporters. Analysts estimate trade between the EU and Japan could increase by nearly 36 billion euro (euro) once the agreement is implemented in full.
Finally: We’ve all heard and seen the advice given to young (and not so young) job-seekers: “Learn to code – that’s where the jobs are!” Coding (or, to use the more traditional term, “programming”) jobs in particular, and all “IT” jobs in general were supposed to be plentiful and going begging for qualified candidates. Except a funny thing has happened on the way to employment nirvana. Several months in the last year and now two months in a row, the “Information” industry segment has actually shrunk its employment while nearly all other industries are adding. January’s “blowout” and “beyond all expectations” jobs number had one stinker in it: a loss of 4,000 jobs in the “Information” industry.

(sources: all index return data from Yahoo Finance; Reuters, Barron’s, Wall St Journal, Bloomberg.com, ft.com, guggenheimpartners.com, zerohedge.com, ritholtz.com, markit.com, financialpost.com, Eurostat, Statistics Canada, Yahoo! Finance, stocksandnews.com, marketwatch.com, wantchinatimes.com, BBC, 361capital.com, pensionpartners.com, cnbc.com, FactSet) These are the opinions of WE Sherman and Co and not necessarily those of Cambridge, are for informational purposes only, and should not be construed or acted upon as individualized investment advice.
Securities offered through Registered Representatives of Cambridge Investment Research Inc., a broker-dealer, member FINRA/SIPC. Advisory Services offered through Cambridge Investment Research Advisors, a Registered Investment Adviser. Strategic Investment Partners and Cambridge are not affiliated.
Indices mentioned are unmanaged and cannot be invested into directly. Past performance is no guarantee of future results. All Investing involves risk. Depending on the types of investments, there may be varying degrees of risk. Investors should be prepared to bear loss, including total loss of principal.