
2-11-19 Weekly Market Update
The very big picture:
In the “decades” timeframe, the current Secular Bull Market could turn out to be among the shorter Secular Bull markets on record. This is because of the long-term valuation of the market which, after nine years, has reached the upper end of its normal range.
The long-term valuation of the market is commonly measured by the Cyclically Adjusted Price to Earnings ratio, or “CAPE”, which smooths out shorter-term earnings swings in order to get a longer-term assessment of market valuation. A CAPE level of 30 is considered to be the upper end of the normal range, and the level at which further PE-ratio expansion comes to a halt (meaning that increases in market prices only occur in a general response to earnings increases, instead of rising “just because”).
Of course, a “mania” could come along and drive prices higher – much higher, even – and for some years to come. Manias occur when valuation no longer seems to matter, and caution is thrown completely to the wind as buyers rush in to buy first and ask questions later. Two manias in the last century – the 1920’s “Roaring Twenties” and the 1990’s “Tech Bubble” – show that the sky is the limit when common sense is overcome by a blind desire to buy. But, of course, the piper must be paid and the following decade or two are spent in Secular Bear Markets, giving most or all of the mania gains back.

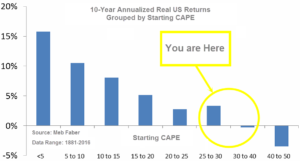
See Fig. 1 for the 100-year view of Secular Bulls and Bears. The CAPE is now at 29.75, unchanged from the prior week, about the level reached at the pre-crash high in October, 2007. Since 1881, the average annual return for all ten year periods that began with a CAPE around this level have been in the 0% – 3%/yr. range. (see Fig. 2).
In the big picture:
The “big picture” is the months-to-years timeframe – the timeframe in which Cyclical Bulls and Bears operate. The U.S. Bull-Bear Indicator (see Fig. 3) is in Cyclical Bull territory at 57.13, up from the prior week’s 54.83.

In the intermediate and Shorter-term picture:
The Shorter-term (weeks to months) Indicator (see Fig. 4) turned positive on November 28th. The indicator ended the week at 36, up from the prior week’s 34. Separately, the Intermediate-term Quarterly Trend Indicator – based on domestic and international stock trend status at the start of each quarter – was negative entering January, indicating negative prospects for equities in the first quarter of 2019.

Timeframe summary:
In the Secular (years to decades) timeframe (Figs. 1 & 2), the long-term valuation of the market is simply too high to sustain rip-roaring multi-year returns. The Bull-Bear Indicator (months to years) remains positive (Fig. 3), indicating a potential uptrend in the longer timeframe. In the intermediate timeframe, the Quarterly Trend Indicator (months to quarters) is negative for Q1, and the shorter (weeks to months) timeframe (Fig. 4) is positive. Therefore, with two indicators positive and one negative, the U.S. equity markets are rated as Neutral.
In the markets:
U.S. Markets: U.S. stocks managed to move modestly higher this week as most of the major indexes recorded their seventh consecutive week of gains. Within the S&P 500, utilities shares performed the best followed by large industrials and information technology shares. The Dow Jones Industrial Average finished the week up just 42 points to 25,106—a gain of 0.2%. The technology-heavy NASDAQ Composite added 34 points, or 0.5%, closing at 7,298. By market cap, smaller cap stocks continued to outperform with the small cap Russell 2000 index and mid cap S&P 400 indexes rising 0.3% and 0.6%, respectively, while the large cap S&P 500 index finished essentially unchanged, up just 1.3 points.
International Markets: Canada’s TSX rose a seventh week, adding 0.8%, while across the Atlantic the United Kingdom’s FTSE gained 0.7%. However, on Europe’s mainland major markets finished the week in the red. France’s CAC 40 declined -1.1%, along with Germany’s DAX which fell -2.4%. In Asia, China’s Shanghai Composite rose for a fifth consecutive week, up 0.6% and Japan’s Nikkei retreated -2.2%. As grouped by Morgan Stanley Capital International, emerging markets ended the week down -1.4%, while developed markets lost -1.0%.
Commodities: Precious metals retraced some of last week’s gains, with Gold falling -0.3% to $1318.50 an ounce and Silver giving up -0.8% to $15.81 per ounce. In energy, crude oil gave up the last three weeks of gains falling ‑4.6% to $52.72 per barrel. The industrial metal copper, seen by analysts as a barometer of global economic health due its wide variety of uses, finished the week up 1.4% – its fifth consecutive week of gains.
U.S. Economic News: The number of people applying for new unemployment benefits dropped by 19,000 last week to 234,000, retracing most of the big upswing of the previous week. However, the number missed the consensus forecast of a 28.000 decline to 225,000 claims. The monthly average of new claims, smoothed to iron-out the weekly volatility, picked up by 4,500 to 224,750. Claims still remain well below the 300,000 threshold economists use to indicate a “healthy” jobs market. Continuing claims, which counts the number of people already receiving benefits, dropped by 42,000 to 1.74 million. That number is reported with a one-week delay.
Most economic reports originating from the U.S. government are still delayed due to the government shutdown. One that did manage to get released showed that factory orders in the U.S. fell more sharply than expected in November. Orders dropped -0.6% in November, their second consecutive decline and contrary to the consensus forecast of a 0.1% gain. The weakness was largely due to lower oil prices. However, one bright spot was an increase in orders for goods expected to last at least three years – so-called “durable goods” – which rose 0.7%. Durable goods orders were led by defense-oriented aircraft, ships and boats. However, ex-transportation, durable goods orders were actually down 0.4% and have been down three of the last four quarters.
The Institute for Supply Management (ISM) reported that its non-manufacturing index remained in positive territory but fell 1.3 points last month to 56.7, a six-month low. The reading was worse than consensus estimates of a 1-point decline and was its third decline in the past four months. Several industries reported adverse effects from the government shutdown. However analysts note that although services activity has been moderating, it is still showing above trend growth. In the details, the decline was led by a 5.0 point drop in the new orders index—its largest decline since August of 2016. The ISM index is compiled from a survey of executives who order raw materials and other supplies for their companies. The gauge tends to rise or fall in tandem with the health of the economy.
International Economic News: The Canadian economy’s recent underperformance relative to the United States has put downward pressure on the country’s currency, but that should help the Canadian economy according to a Bank of Canada official. In a speech on how Canada manages its foreign exchange reserves, Deputy Governor Tim Lane noted the benefits of the country’s floating exchange rate policy that has allowed it to quickly adjust to shocks and keep reserves at low levels. Speaking at the Peterson Institute for International Economics in Washington, Lane stated “To a certain extent, movements in the Canadian dollar reflect the comparative strengths of the Canadian and U.S. economies — which are linked, in turn, to expectations for each country’s monetary policy path.”
Across the Atlantic, pro-EU Bank of England Governor Mark Carney slashed this year’s growth forecast for the United Kingdom to just 1.2%–the lowest since 2009. The downgrade was a significant reduction below Carney’s estimate of 1.7% growth from just November. Pro-Brexit Member of Parliament Lord Forsyth ridiculed the Bank of England governor for yet his latest gloomy economic forecast. Forsyth noted, “I chair the Economic Affairs Committee and we have the governor of the Bank before us every year…I can tell you that of his forecasts – if he gets two out of 12 right he would be doing very well.” He added: “On past experience, he has been wrong consistently.”
France and Italy are in their biggest diplomatic spat since World War II. France’s pro-European Union government recalled its ambassador to Italy after accusing Italy of meddling in its internal affairs. French officials said Friday that this week’s recall of French Ambassador Christian Masset was prompted by months of “unfounded attacks” from Italian government members Luigi Di Maio and Matteo Salvini, who have criticized French President Emmanuel Macron’s economic and migration policies. But the main trigger for the crisis appeared to be Di Maio’s meeting in a Paris suburb this week with members of the yellow vests, a French anti-government movement seeking seats in the European Parliament. French government spokesman Benjamin Griveaux said the visit violated “the most elementary diplomacy” because it was unannounced.
Europe’s economic powerhouse Germany may be in trouble as factory production declined unexpectedly in December. The Federal Statistical Office reported industrial production dropped 0.4% from the month before, while factory orders also slipped. In both cases, economists had been predicting increases and the developments raised speculation Germany may have entered contraction in the fourth quarter of 2018 for a second quarter—implying it has entered a technical recession. Last week, the government slashed its 2019 economic growth forecast from 1.8% to just 1%. Germany’s economy grew just 1.5% last year, down from 2.2% in 2017. In January, officials said it appeared Germany had avoided recession, but fourth-quarter numbers haven’t yet been finalized.
China and the U.S. are scheduled to hold high-level economic and trade talks in Beijing this month. Chinese Vice Premier Liu He will meet with U.S. Trade Representative Robert Lighthizer and Treasury Secretary Steven Mnuchin February 14th and 15th to expand on the recently conducted talks in the United States. The visit comes as Chinese Ambassador to the United States Cui Tiankai stated this week that China and the U.S. need to develop even stronger ties in the future despite differences. Noting that China and the United States are “two very different countries” in terms of history and culture, Cui said it was important for the two sides to “have a much better mutual understanding” for each other’s intentions and policies and to identify common ground upon which to stabilize the relationship.
Household spending in Japan increased slightly in December suggesting that a pickup in domestic consumption may help moderate economic pressures from slowing global demand. The data comes as some relief to Bank of Japan policymakers worried that rising overseas economic uncertainties may discourage firms from raising wages. The 0.1% year-on-year gain fell far short of a median market forecast for a 0.8% rise but followed a revised 0.5% drop in November. However, taken together with separate wages data, the numbers suggested higher household income may help underpin consumption. Prime Minister Shinzo Abe’s “Abenomics” stimulus policies have boosted corporate profits by lifting stocks and giving exporters a competitive advantage overseas through a weaker yen. But they have failed to equally fire up private consumption, which accounts for about 60% of gross domestic product (GDP).
Finally: According to a CBS Evening News instant poll, President Donald Trump’s recent State of the Union address was viewed favorably by almost three quarters of viewers. President Trump touted many of his accomplishments in his first 2 years in office. Chief among them is his rightful claim to a bustling economy. Nonetheless, in the normal ebb and flow of the large U.S. economy, there will always be a few sectors that fare less well even in the best of times. So, as an antidote to all the usual State of the Union bragging (and not to take anything away from President Trump and his rightful claims), here are a handful of sectors that have actually shrunk under Trump (visual from Atlas.com, data from the Bureau of Labor Statistics). Note that all but one are retail stores or services. The only goods-producing sector on the list is “Textile product mills”, perhaps reflecting Trump’s emphasis on restoring U.S. manufacturing to global preeminence.

(sources: all index return data from Yahoo Finance; Reuters, Barron’s, Wall St Journal, Bloomberg.com, ft.com, guggenheimpartners.com, zerohedge.com, ritholtz.com, markit.com, financialpost.com, Eurostat, Statistics Canada, Yahoo! Finance, stocksandnews.com, marketwatch.com, wantchinatimes.com, BBC, 361capital.com, pensionpartners.com, cnbc.com, FactSet) These are the opinions of WE Sherman and Co and not necessarily those of Cambridge, are for informational purposes only, and should not be construed or acted upon as individualized investment advice.
Securities offered through Registered Representatives of Cambridge Investment Research Inc., a broker-dealer, member FINRA/SIPC. Advisory Services offered through Cambridge Investment Research Advisors, a Registered Investment Adviser. Strategic Investment Partners and Cambridge are not affiliated.
Indices mentioned are unmanaged and cannot be invested into directly. Past performance is no guarantee of future results. All Investing involves risk. Depending on the types of investments, there may be varying degrees of risk. Investors should be prepared to bear loss, including total loss of principal.