
1-28-19 Weekly Market Update
The very big Picture:
In the “decades” timeframe, the current Secular Bull Market could turn out to be among the shorter Secular Bull markets on record. This is because of the long-term valuation of the market which, after nine years, has reached the upper end of its normal range.
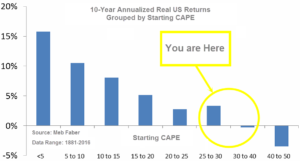
The long-term valuation of the market is commonly measured by the Cyclically Adjusted Price to Earnings ratio, or “CAPE”, which smooths out shorter-term earnings swings in order to get a longer-term assessment of market valuation. A CAPE level of 30 is considered to be the upper end of the normal range, and the level at which further PE-ratio expansion comes to a halt (meaning that increases in market prices only occur in a general response to earnings increases, instead of rising “just because”).
Of course, a “mania” could come along and drive prices higher – much higher, even – and for some years to come. Manias occur when valuation no longer seems to matter, and caution is thrown completely to the wind as buyers rush in to buy first and ask questions later. Two manias in the last century – the 1920’s “Roaring Twenties” and the 1990’s “Tech Bubble” – show that the sky is the limit when common sense is overcome by a blind desire to buy. But, of course, the piper must be paid and the following decade or two are spent in Secular Bear Markets, giving most or all of the mania gains back.

See Fig. 1 for the 100-year view of Secular Bulls and Bears. The CAPE is now at 29.28, little changed from the prior week’s 29.36, about the level reached at the pre-crash high in October, 2007. Since 1881, the average annual return for all ten year periods that began with a CAPE around this level have been in October, 2007. Since 1881, the average annual return for all ten year periods that began with a CAPE around this level have been in the 0% – 3%/yr. range. (see Fig. 2).
In the Big Picture:
The “big picture” is the months-to-years timeframe – the timeframe in which Cyclical Bulls and Bears operate. The U.S. Bull-Bear Indicator (see Fig. 3) is in Cyclical Bull territory at 52.46, up from the prior week’s 50.51.

In the intermediate and Shorter-term Picture:
The Shorter-term (weeks to months) Indicator (see Fig. 4) turned positive on November 28th. The indicator ended the week at 27, up from the prior week’s 25. Separately, the Intermediate-term Quarterly Trend Indicator – based on domestic and international stock trend status at the start of each quarter – was negative entering January, indicating negative prospects for equities in the first quarter of 2019.

Timeframe summary:
In the Secular (years to decades) timeframe (Figs. 1 & 2), the long-term valuation of the market is simply too high to sustain rip-roaring multi-year returns. The Bull-Bear Indicator (months to years) remains positive (Fig. 3), indicating a potential uptrend in the longer timeframe. In the intermediate timeframe, the Quarterly Trend Indicator (months to quarters) is negative for Q1, and the shorter (weeks to months) timeframe (Fig. 4) is positive. Therefore, with two indicators positive and one negative, the U.S. equity markets are rated as Neutral.
In the Markets:
U.S. Markets: Following four weeks of solid gains the major U.S. benchmarks ended the week flat. The Dow Jones Industrial Average added just 30 points last week ending the week at 24,737, a gain of 0.1%. The technology-heavy NASDAQ Composite rose 7 points, also up 0.1%. By market cap, the large cap S&P 500 finished down -0.2%, while the mid cap S&P 400 rose 0.1% and the small cap Russell 2000 remained unchanged.
International Markets: Canada’s TSX rose 0.4%, while the United Kingdom’s FTSE 100 finished down -2.3%. Major markets on Europe’s mainland finished the week in the green with France’s CAC 40 adding 1.0%, and Germany’s DAX and Italy’s Milan FTSE adding 0.7% and 0.5%, respectively. In Asia, China’s Shanghai Composite rose 0.2% and Japan’s Nikkei added 0.5%. As grouped by Morgan Stanley Capital International, emerging markets rose 1.6% (continuing their strong start to 2019 after a miserable 2018), while developed markets finished up just 0.1%.
Commodities: Precious metals bounced back this week with Gold rising 1.2%, or $15.50 to finish the week at $1298.10 per ounce. Silver also rose, up 1.95% to finish the week at $15.70 per ounce. Oil took a break after three weeks of solid gains, ending the week down -0.65% at $53.69 per barrel. The industrial metal copper, seen by some analysts as a barometer of global economic health due to its variety of uses, rose for a third consecutive week up 0.4%.
U.S. Economic News: For the first time in over 50 years, the number of applicants for new unemployment benefits fell below 200,000. The Labor Department reported initial jobless claims fell by 13,000 to 199,000 in the week ended January 19th. The reading is the lowest since November 15, 1969 and underscores the strength of the U.S. labor market despite a government shutdown and global trade tensions. The more stable monthly average of new claims fell by 5,500 to 215,000. Continuing claims, which counts the number of people already receiving benefits, fell by 24,000 to 1.71 million. That number is reported with a one-week delay.
The number of existing homes sold in December slid to a three-year low last month, another sign that the housing market continues to cool. The National Association of Realtors (NAR) reported existing-home sales ran at a seasonally-adjusted annual rate of 4.99 million in December, down 6.4% for the month and 10.3% from the same time last year. The reading was far below the consensus forecast of a 5.1 million selling pace. The NAR’s full-year sales tally for 2018 of 5.34 million homes sold made it the worst year since 2015 when the housing market was hit by a change in mortgage regulations. In the details of the NAR report, the available number of homes on the market also shrunk. At the current sales pace, it would take 3.7 months to exhaust the available supply, down from 3.9 months in November. Analysts generally consider a 6 month supply of homes on the market to be a “balanced” market.
Research firm IHS/Markit reported its flash Purchasing Managers Index (PMI) for manufacturing rebounded 1.1 points to 54.9 this month, its first increase in three months. In the details, factory activity picked up at the start of the year, and output grew at its fastest rate since May of 2018. New orders, employment, and inventory growth also accelerated. However, in contrast, Markit’s flash services PMI slipped 0.2 points to 54.2. Readings over 50 still indicate expansion. Chris Williamson, chief business economist at IHS Markit stated in the release, “US businesses reported a solid start to 2019, with the rate of expansion running only slightly weaker than the average seen in the second half of last year.”
Leading indicators for the U.S. pulled back in December, suggesting slower growth ahead. The Conference Board reported its Leading Economic Index (LEI) fell 0.1% in December, its second decline in the final quarter of 2018. Ataman Ozyildirim, director of economic research at the board stated, “The US LEI declined slightly in December and the recent moderation in the LEI suggests that the US economic growth rate may slow down this year.” Furthermore, he added that the LEI now suggests that the economy could decelerate toward 2% growth by the end of 2019. The reading was in line with consensus expectations.
There were no economic reports published by any U.S. Government entities this week, due to the partial government shutdown.
International Economic News: Global Macro Strategist Jim Mylonas at BCA Research in Montreal released a note speculating that Canada’s economy may soon endure something it hasn’t faced in 68 years—a recession without the U.S. also being in recession. Mylonas says that a surge in Canadian household debt combined with rising interest rates will push the Canadian economy into recession, even while the U.S. economy continues to grow. “I think we’re just on the precipice of embarking on a serious recession,” Mylonas said. “It’s not a matter of if, but when.” His reasoning is that surprisingly strong growth in the U.S. will the force the Federal Reserve and subsequently the Bank of Canada to raise interest rates. Mylonas stated that the debt-laden Canadian consumer is ill-equipped to handle higher borrowing costs, unlike their U.S. counterparts who dialed back borrowing following the housing crash a decade ago.
Bank of England Governor Mark Carney said that there is still little clarity on how the U.K. will leave the European Union this year, but his institution has been preparing for a so-called “hard Brexit” since the referendum vote back in 2016. He said the bank’s stress tests on what could happen in the event of a “hard Brexit,” in which the U.K. leaves the EU on March 29 with no withdrawal agreement in place (and, crucially, no 21-month transition period), were part of its attempts to test the waters about what might happen. In November, the BOE predicted should Brexit occur U.K. GDP would go down by 8%, commercial real estate would fall by 50% and house prices would decline by a third. In addition, unemployment would rise to almost 9% while interest rates would have to go up. The Bank of England was criticized for scaremongering by Brexiteers ahead of the 2016 referendum on whether to stay or leave the European Union with similar predictions of economic harm in the event of a “leave” result, labeled by critics as a part of the BOE’s “project fear.”
On Europe’s mainland, IHS/Markit’s measure of manufacturing and services activity in France dropped to 47.9 —the lowest level in more than four years. The reading was a significant miss. The consensus forecast was for a rebound to 51. Readings below 50 indicate contraction. Despite the poor reading, French Finance Minister Bruno Le Maire stated France will stick to its forecast for 2019 of 1.7% economic growth. In addition, he stated he had broader plans to tax the world’s biggest internet and software companies and tackle the power of giant multinational corporations.
Europe’s economic powerhouse Germany is also facing headwinds as manufacturing activity slumped in the first reading of the year. IHS/Markit reported its monthly index showed manufacturing activity in Germany contracted for the first time in four years. The gauge fell to 49.9 from 51.5 with new orders falling at their sharpest pace since 2012. The reading coincided with research firm Zew’s findings. Zew reported its assessment of the current economic situation in Germany plunged 17.7 points to 26.7, its lowest reading since January of 2015. In the details of the report, the survey of German analysts indicated a slight improvement in sentiment with a 2.5-point rise to -15, but still negative. Achim Wambach, Zew president stated, “It is remarkable that the Zew economic sentiment for Germany has not deteriorated further given the large number of global economic risks.”
In Asia, the Chinese economy grew at its slowest pace in 28 years last year, adding to the urgency for President Xi Jinping to reach a trade deal with the United States. China announced that its official economic growth rate came in at 6.6% for 2018, matching economists’ estimates. Although the trade war is not the main reason for last year’s slowdown, it is not helping. Andrew Collier, managing director of Orient Capital Research stated, “The economy is a much bigger problem for Xi Jinping than the trade war. The last thing he wants is a bunch of angry people protesting because they’ve lost their jobs.” Retail sales, industrial production and property sales all slowed in the final quarter of last year. Car sales were particularly – and surprisingly – poor, recording the first annual drop in more than two decades.
Japan’s Prime Minister Shinzo Abe said China’s slowing growth, concerns over Brexit, and U.S.-China trade disputes pose risks to the world economy. In an environment of growing isolationism Abe announced his two “mega deals” in trade – the Trans-Pacific Partnership and the European Union-Japan Economic Partnership. In addition, Abe said the World Trade Organization needs to be changed, calling for a trading system that protects intellectual property rights. Analysts state it was a veiled reference to China, which the Trump administration and others say is cheating on trade rules and stealing intellectual property from both Western and Japanese companies. “We have to make the WTO into a more credible existence. We need to reform it,” Abe stated.
Finally: Anyone who has driven on a cross-country road trip through Middle America has seen at one of these in each of the towns you pass. What are we talking about? Why Walmart Supercenters, of course! That means that Walmart employs a whole lot of people – in fact, Walmart is the top private employer in 21 states! With over 3,500 Walmart Supercenters spread across all 50 states, Walmart has over 1.5 million employees (or “associates”, as Walmart calls them). This graphic, from visualcapitalist.com, shows where Walmart Nation is. Interestingly, there are only 5 other states where a private non-education non-healthcare company is that state’s largest employer.

(sources: all index return data from Yahoo Finance; Reuters, Barron’s, Wall St Journal, Bloomberg.com, ft.com, guggenheimpartners.com, zerohedge.com, ritholtz.com, markit.com, financialpost.com, Eurostat, Statistics Canada, Yahoo! Finance, stocksandnews.com, marketwatch.com, wantchinatimes.com, BBC, 361capital.com, pensionpartners.com, cnbc.com, FactSet) These are the opinions of WE Sherman and Co and not necessarily those of Cambridge, are for informational purposes only, and should not be construed or acted upon as individualized investment advice.
Securities offered through Registered Representatives of Cambridge Investment Research Inc., a broker-dealer, member FINRA/SIPC. Advisory Services offered through Cambridge Investment Research Advisors, a Registered Investment Adviser. Strategic Investment Partners and Cambridge are not affiliated.
Indices mentioned are unmanaged and cannot be invested into directly. Past performance is no guarantee of future results. All Investing involves risk. Depending on the types of investments, there may be varying degrees of risk. Investors should be prepared to bear loss, including total loss of principal.