2-3-20 Weekly Market Update
The very Big Picture
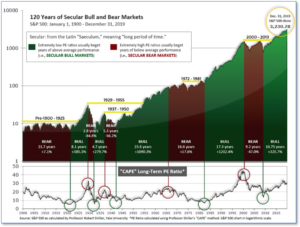
The long-term valuation of the market is commonly measured by the Cyclically Adjusted Price to Earnings ratio, or “CAPE”, which smooths-out shorter-term earnings swings in order to get a longer-term assessment of market valuation. A CAPE level of 30 is considered to be the upper end of the normal range, and the level at which further PE-ratio expansion comes to a halt (meaning that further increases in market prices only occur as a general response to earnings increases, instead of rising “just because”). The market is currently at that level.
Of course, a “mania” could come along and drive prices higher – much higher, even – and for some years to come. Manias occur when valuation no longer seems to matter, and caution is thrown completely to the wind – as buyers rush in to buy first, and ask questions later. Two manias in the last century – the “Roaring Twenties” of the 1920s, and the “Tech Bubble” of the late 1990s – show that the sky is the limit when common sense is overcome by a blind desire to buy. But, of course, the piper must be paid, and the following decade or two were spent in Secular Bear Markets, giving most or all of the mania-gains back.

See Fig. 1 for the 100-year view of Secular Bulls and Bears. The CAPE is now at 30.84, down from the prior week’s 31.51, above the level reached at the pre-crash high in October, 2007. Since 1881, the average annual return for all ten-year periods that began with a CAPE around this level have been flat to slightly-negative (see Fig. 2).

The Big Picture:
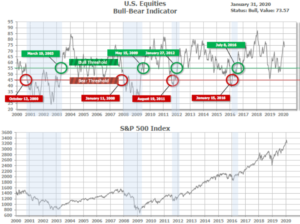
The ‘big picture’ is the (typically) years-long timeframe – the timeframe in which Cyclical Bulls and Bears operate. The U.S. Bull-Bear Indicator (Fig. 1) is in Cyclical Bull territory at 73.57, down from the prior week’s 77.03.

In the Intermediate and Shorter-term Picture:
The Shorter-term (weeks to months) Indicator (see Fig. 4) is Negative. The indicator ended the week at 25, down from the prior week at 34.. Separately, the Intermediate-term Quarterly Trend Indicator – based on domestic and international stock trend status at the start of each quarter – was positive entering January, indicating positive prospects for equities in the first quarter of 2020.

The complete picture:
Counting up the number of all our indicators that are ‘Up’ for U.S. Equities, we are in ‘Mostly Positive’ territory (See Fig 3). This status is drawn from a scale that goes from Negative, to Mostly Negative, to Neutral, to Mostly Positive, to Positive, and totals-up current readings based on a multitude of timeframes (days/weeks/months/quarters/years, the ‘years’ being the Cyclical Bull or Bear reading).
In the markets:
U.S. Markets: The major U.S. equity benchmarks lost ground for the week as concerns continued to grow over the impact of the coronavirus on global economies. The technology-heavy NASDAQ Composite index held up the best giving up “only” -1.8%, while the smaller-cap benchmarks fared the worst. The Dow Jones Industrial Average lost 733 points to finish the week at 28,256, a decline of -2.5%. The large cap S&P 500 finished down -2.1%, while the S&P 400 midcap and small cap Russell 2000 indexes declined -2.8% and -2.9%, respectively.
International Markets: It was a similar story across international markets. Canada’s TSX retreated -1.4% while the FTSE 100 declined -4.0%. On Europe’s mainland, France’s CAC 40 fell -3.6%, Germany’s DAX plunged -4.4%, and Italy’s Milan FTSE declined -3.1%. In Asia, China’s Shanghai Composite was closed for the week for the Chinese Lunar New Year holiday. Japan’s Nikkei ended the week down -2.6%. As grouped by Morgan Stanley Capital International, emerging markets finished down -5.6%, while developed markets gave up -2.9%.
Commodities: Precious metals finished the week mixed. Gold rose 1.0% to end the week at $1587.90 an ounce, while Silver finished the week down -0.6% to $18.01. The industrial metal copper, known as “Dr. Copper” to some analysts due to its value in gauging world economic health, plunged over -6.2%. Energy sold off for a fourth consecutive week. West Texas Intermediate crude oil retreated -4.9% to $51.56 per barrel.
January Summary: The great majority of equity indexes finished January lower. In the U.S., the Dow Jones Industrial Average closed down -1.0% in January, while the Nasdaq Composite rose 2.0%. By market cap, the large cap S&P 500 declined -0.2%, mid caps gave up -2.7%, and small caps finished down ‑3.3%. In international markets, Canada’s TSX gained 1.5%, while the United Kingdom’s FTSE gave up -3.4%. France’s CAC declined -2.9%, Germany’s DAX ended down ‑2%, and Italy’s Milan FTSE gave up -1.2%. In Asia, China’s Shanghai Composite retreated -2.4%, while Japan’s Nikkei ended down -1.9%. As grouped by Morgan Stanley Capital International, emerging markets plunged -6.2% in January and developed markets finished the month down -2.8%. Commodities were decidedly mixed in January. Gold and Silver finished the month up 4.3% and 0.5%, respectively, but Oil and Copper plunged -15.6% and -10.0%.
U.S. Economic News: The number of Americans seeking first-time unemployment benefits fell slightly last week, indicating the labor market remains robust. The Labor Department reported initial jobless claims declined by 7,000 to 216,000 and that the more stable monthly average of new claims fell by 1,750 to 214,500. New unemployment claims briefly fell under 200,000 last April to a 50-year low, and have remained near that level ever since. Continuing claims, which counts the number of people already receiving benefits, fell by 44,000 to 1.7 million—also close to post-recession lows. That number is reported with a one-week delay.
Home prices continued to rise in November as buyers founder fewer homes to buy. S&P/CoreLogic reported their Case-Shiller 20-city home price index increased 2.6% in November from the same time last year. Month-over-month the index ticked up just 0.1% in November compared with October on a seasonally-adjusted basis. Nationwide, home prices were up on an annual basis by 3.5% – a faster rate of appreciation than in October. Phoenix, Charlotte, N.C., and Tampa, Florida comprised the top three cities with the highest home-price appreciation. Notably, all 20 of the cities the index tracks reported price increases.
The number of pending home sales, or transactions in which a contract has been signed but not yet closed, declined 4.9% in December from the previous month, the National Association of Realtors (NAR) reported. By region, sales were down 5.5% in the South, 5.4% in the West, 4% in the Northeast, and 3.6% in the Midwest. The drop in contract signings in December suggests that the existing home sales reports coming out in the near future will likely be weak. Lawrence Yun, NAR chief economist, blamed high prices and not enough inventory for the decline. “The state of housing in 2020 will depend on whether home builders bring more affordable homes to the market,” he wrote.
Orders for goods expected to last at least three years, so-called “durable goods”, surged 2.4% in December, the Commerce Department reported, but most of the gain was due to the military. Stripping out orders for ships, aircraft, and weapons systems, orders were actually down -2.5%. Economists had expected a decline of just 0.3% in orders. Adding to the disappointing report, the government revised orders for November to show an even bigger 3.1% drop. Economists at Citibank told clients in a note “Investment could remain soft early in the year as a production stoppage of certain planes is likely to last for longer than initially assumed.”
Confidence among the nation’s consumers hit its highest level in five months at the start of 2020, the Conference Board reported. Buoyed by a “phase one” trade deal with China, a soaring stock market (at the time), and the lowest unemployment rate in 50 years, Americans began the new year with the most confidence since the prior summer. The Consumer Confidence index rose 3.4 points to 131.6 in January. In the details, the index that gauges how consumers feel about the economy at the moment rose 5 points to 175.3, while the index that assesses how Americans view the next six months – the so-called future expectations index – edged up 2.5 points to 102.5. Lynn Franco, director of economics at the Conference Board stated, “Optimism about the labor market should continue to support confidence in the short-term and, as a result, consumers will continue driving growth and prevent the economy from slowing in early 2020.”
Stressing that the U.S. economy is in good shape, the Federal Reserve left its key interest rate unchanged but stated it is closely monitoring the severity of the deadly coronavirus and its impact on the global economy. The central bank reiterated its view that the U.S. is growing at a “moderate rate” while inflation remains subdued. In a separate move, the Fed raised a special interest rate on banks meant to ensure the efficient functioning of financial markets and help the central bank keep a better handle on short-term interest rates. The central bank voted to lift the rate it pays banks for excess reserves parked at the central bank, known as the IOER for “Interest On Excess Reserves”, to 1.6% from 1.55%. Powell characterized the move as a “small technical adjustment” made necessary by all the liquidity flooding into the market.
GDP for the fourth quarter of 2019 was reported at 2.1%, with a boost from the shrinking trade deficit and a resurgent housing market. Analysts had forecast an increase of just 1.9%. The U.S. got off to a strong start last year as GDP surged 3.1% in the first quarter, but growth tapered off to around the 2% average as the trade war with China intensified and business investment slumped. The main engine of the U.S. economy, consumer spending, rose at a 1.8% pace in the fourth quarter. Household spending continued to underpin the economy over the past year as unemployment fell to a 50-year low of 3.5%. Looking ahead, most economists predict the U.S. will grow less than 2% in 2020, compared with 2.3% in 2019 and 2.9% in 2018.
International Economic News: Statistics Canada reported that Canada’s economy ticked up 0.1% in November, despite an unexpected cold snap. Analysts had forecast no change. Both goods-producing industries and the services sector posted identical 0.1% gains. Royce Mendes, senior economist at CIBC Capital Markets wrote in a note, “The above‑consensus reading was surprising given the temporary factors which were expected to restrain growth – pipeline outage, rail strike, weather – and should limit the downside risk to the Bank of Canada’s Q4 forecast.” Canada’s central bank cut its fourth quarter annualized growth forecast to 0.3% in October and said it would be closely monitoring developments in consumer spending, the housing market and business investment.
In the UK, Brexit finally happened. After years of turmoil and back-and-forth negotiations, Britain has finally exited the European Union. Prime Minister Boris Johnson, leader of the Conservative Party stated in a speech, “Our job as the government — my job — is to bring this country together and take us forward.” The United Kingdom was the bloc’s second-largest economy. U.S. Ambassador Robert Johnson said in a statement, “Now that the U.K. is back in control of its own trade policy, we look forward to achieving a broad free trade agreement that will increase prosperity and create jobs in both our countries.”
On Europe’s mainland, the French economy shrank 0.1% in the fourth quarter as protests against President Emmanuel Macron’s pension reforms weighed on business activity. France’s economy minister Bruno Le Maire had said recently that the French strikes would cost the country 0.1 percentage points in growth of its gross domestic product. However, Capital Economics’ Jessica Hinds doesn’t see further negative impacts from the strikes going forward. Evidence from previous strikes suggests that any economic impact is likely to be “limited and short-lived,” Ms. Hinds said.
After barely escaping a recession last year, the Germany economy is experiencing a tentative revival. Peter Altmaier, German Economy Minister, said the recovery had reached a “turning point”. “After two difficult years when we had to revise down our forecasts and growth rates were very low, we are now seeing a silver lining on the horizon,” Altmaier said. The government raised its forecast for growth to 1.1% this year as international trade tensions eased. The government is also stepping up investment to €162.4bn over the next four years, one-third more than in the previous parliament.
Japanese Economy Minister Yasutoshi Nishimura warned that corporate profits and factory production might take a hit from the coronavirus outbreak in China that has rattled global equity markets. “There are concerns over the impact to the global economy from the spread of infection in China, transportation disruptions, cancellation of group tours from China and an extension in the Lunar Holiday,” Nishimura told a news conference after a regular cabinet meeting. “If the situation takes longer to subside, we’re concerned it could hurt Japanese exports, output and corporate profits via the impact on Chinese consumption and production,” he said. Automaker Honda Motor, which has three plants in Wuhan, the epicenter of the outbreak, plans to evacuate some staff.
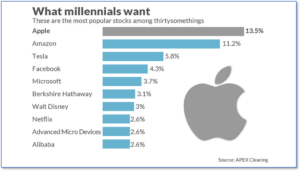
Finally: Millennials are now becoming investors in greater and greater numbers. The trade-clearing firm Apex recently released a study identifying the stocks most favored by millennials. The top 10 most-widely-held stocks are perhaps not a big shock – the chart below from Marketwatch.com shows the top 10, which contain 4 of the 5 so-called “FAANG” stocks (Facebook, Apple, Amazon, Netflix, Google), with the 5th (Google) at no. 12. Surprisingly, Berkshire Hathaway, a decidedly non-tech behemoth headed by the legendary Warren Buffett, comes in at no. 6. Apex CMO Hannah Shaw Grove said “One thing is for certain – millennials are investing in the future. Their fingers are always on the pulse of tech trends, innovation, and those companies which are in a position to influence the way we live and conduct business.”

(Sources: All index- and returns-data from Yahoo Finance; news from Reuters, Barron’s, Wall St. Journal, Bloomberg.com, ft.com, guggenheimpartners.com, zerohedge.com, ritholtz.com, markit.com, financialpost.com, Eurostat, Statistics Canada, Yahoo! Finance, stocksandnews.com, marketwatch.com, wantchinatimes.com, BBC, 361capital.com, pensionpartners.com, cnbc.com, FactSet) Securities offered through Registered Representatives of Cambridge Investment Research Inc., a broker-dealer, member FINRA/SIPC. Advisory Services offered through Cambridge Investment Research Advisors, a Registered Investment Adviser. Strategic Investment Partners and Cambridge are not affiliated.
Indices mentioned are unmanaged and cannot be invested into directly. Past performance is no guarantee of future results. All Investing involves risk. Depending on the types of investments, there may be varying degrees of risk. Investors should be prepared to bear loss, including total loss of principal.
