
1-27-20 Weekly Market Update
The very Big Picture (a historical perspective):
The long-term valuation of the market is commonly measured by the Cyclically Adjusted Price to Earnings ratio, or “CAPE”, which smooths-out shorter-term earnings swings in order to get a longer-term assessment of market valuation. A CAPE level of 30 is considered to be the upper end of the normal range, and the level at which further PE-ratio expansion comes to a halt (meaning that further increases in market prices only occur as a general response to earnings increases, instead of rising “just because”). The market is currently at that level.
Of course, a “mania” could come along and drive prices higher – much higher, even – and for some years to come. Manias occur when valuation no longer seems to matter, and caution is thrown completely to the wind – as buyers rush in to buy first, and ask questions later. Two manias in the last century – the “Roaring Twenties” of the 1920s, and the “Tech Bubble” of the late 1990s – show that the sky is the limit when common sense is overcome by a blind desire to buy. But, of course, the piper must be paid, and the following decade or two were spent in Secular Bear Markets, giving most or all of the mania-gains back.
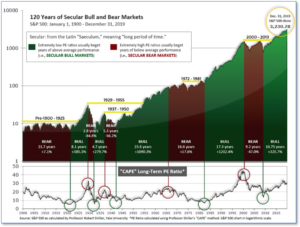
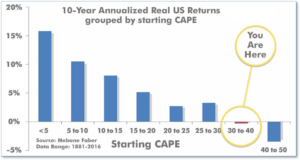
See Fig. 1 for the 100-year view of Secular Bulls and Bears. The CAPE is now at 31.51, down from the prior week’s 31.83, above the level reached at the pre-crash high in October, 2007. Since 1881, the average annual return for all ten-year periods that began with a CAPE around this level have been flat to slightly-negative (see Fig. 2).
The Big Picture:
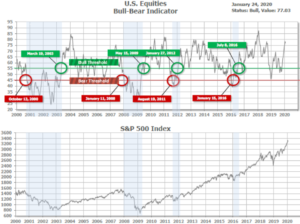
The ‘big picture’ is the (typically) years-long timeframe – the timeframe in which Cyclical Bulls and Bears operate. The U.S. Bull-Bear Indicator (Fig. 3) is in Cyclical Bull territory at 77.03, down from the prior week’s 78.27.
In the Intermediate and Shorter-term Picture:
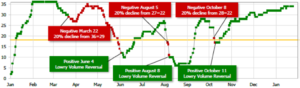
The Shorter-term (weeks to months) Indicator (see Fig. 4) is positive. The indicator ended the week at 34, unchanged from the prior week. Separately, the Intermediate-term Quarterly Trend Indicator – based on domestic and international stock trend status at the start of each quarter – was positive entering January, indicating positive prospects for equities in the first quarter of 2020.
The Complete Picture:
Counting up the number of all our indicators that are ‘Up’ for U.S. Equities, we remain in ‘Positive’ territory. This status is drawn from a scale that goes from Negative, to Mostly Negative, to Neutral, to Mostly Positive, to Positive, and totals-up current readings based on a multitude of timeframes (days/weeks/months/quarters/years, the ‘years’ being the Cyclical Bull or Bear reading).
In the Markets:
U.S. Markets: Fears of a global virus outbreak sent stock prices lower for the holiday-shortened week. The large cap indexes and the technology-heavy NASDAQ Composite index outperformed and touched new record highs, before falling back sharply on Friday. The Dow Jones Industrial Average fell back 358 points to 28,989—a decline of -1.2%. The NASDAQ fared the best giving up just -0.8%, while the large cap S&P 500 declined -1.0%. Smaller cap benchmarks fared the worst. The S&P 400 mid cap index gave up -1.5%, while the small cap Russell 2000 declined -2.2%.
International Markets: Most major international markets also sold off this week. Canada’s TSX managed a slight 0.04% increase, but the United Kingdom’s FTSE fell -1.2%. On Europe’s mainland major markets were mixed. France’s CAC 40 retreated -1.3%, while Germany’s DAX gained 0.4%. Italy’s Milan FTSE finished down -0.7%. In Asia, China’s Shanghai Composite plunged -3.2% on coronavirus fears, while Japan’s Nikkei gave up -0.9%. As grouped by Morgan Stanley Capital International, developed markets retreated -1.3%, while emerging markets dropped -3.5%.
Commodities: Investors moved to precious metals as a safe-haven. Gold rose 0.7% to $1571.90 an ounce, while Silver added 0.2% to $18.11. The industrial metal copper, seen by some analysts as a barometer of global economic health due to its wide variety of uses, plummeted -5.7% after two weeks of gains. Oil also finished the week down sharply. West Texas Intermediate crude oil declined for a third consecutive week plunging -7.5% to $54.19 per barrel.
U.S. Economic News: The number of Americans seeking first-time unemployment benefits rose just slightly last week, but remained near 50-year lows. The Labor Department reported initial jobless claims increased by 6,000 to 211,000. Economists had expected 215,000. The more stable monthly average slipped by 3,250 to 213,250. The number of people already collecting unemployment benefits, known as continuing claims, fell by 37,000 to 1.73 million. That number is reported with a one-week delay.
The National Association of Realtors (NAR) reported that the housing market finished 2019 on a solid note. Existing home sales hit their high mark for the year in December, rising 3.6% as low unemployment and interest rates supported demand. Compared to the same period a year earlier, sales of existing homes were up 10.8%. After a slow start to the year, the second half of 2019 showed a pickup in activity that brought total sales for the year to 5.34 million homes. Supply continues to be tight, however. There was only a 3.0 month supply of homes on the market at the end of December—just half the 6 months generally considered to be a “balanced” housing market. December’s inventory was the lowest for NAR records tracing back two decades.
Economic activity in the services sector expanded at a more robust pace than initially forecast according to IHS Markit. Markit reported its Services Purchasing Managers’ Index (PMI) rose 0.4 point to 53.2 in January. Economists had expected a reading of just 52.9. The latest reading pointed to the strongest pace of expansion in the service sector since last March. It’s especially important as services comprise roughly 80% of the U.S. economy. Markit’s report for the manufacturing sector wasn’t nearly as robust. Markit’s Flash U.S. Manufacturing PMI retreated 0.7 point to 51.7. Sian Jones, economist at IHS Markit noted that the manufacturing sector was “not out of the woods yet, with goods producers seeing only modest gains in output and new orders.”
The Chicago Fed reported that its National Activity Index (CFNAI) reading for December signaled a weaker economy. The index was -0.35 according to the Federal Reserve Bank of Chicago. This is down from the +0.41 reading the month before. Of the four broad categories comprising the index, three weighed it down. The CFNAI takes into account 85 different indicators and 60 of those negatively contributed, the Chicago Fed said, while 25 positively contributed. The reading came in slightly worse than the market expectation of -0.3 as well.
The Conference Board’s Leading Economic Index (LEI) showed economic growth slowed toward the end of last year, but the economy remained stable. The Conference Board reported its LEI fell 0.3% in December—its fourth decline in the past five months. The drop was due in large part to an increase in jobless claims and a decline in building permits for new houses. However, claims have fallen since then and the weakness in permits is seen by most analysts as temporary. The leading index is composed of 10 economic indicators designed to signal peaks and valleys in the business cycle. Despite the decline, economists still expect solid economic growth going forward. Ataman Ozyildirim, economist at the Conference Board said that despite the lower headline number, “…financial conditions and consumers’ outlook for the economy remain positive, which should support growth of about 2% through early 2020.”
International Economic News: The Bank of Canada (BoC) held its key interest rate unchanged but cut its forecasts for growth as Canada’s economy lost momentum. The BoC kept its interest rate at 1.75% and predicted that the Canadian economy would grow by 1.6% this year—down 0.1% from its projection in October. While some of the slowdown late last year is being chalked up to a strike at CN Rail and an outage at the Keystone pipeline, the central bank says the weaker figures could also signal that global uncertainty is affecting Canada more than previously predicted. This week’s report from the bank was a sharp contrast from its last look at the economy, when a degree of domestic resilience remained in spite of weaker data outside of Canada’s borders.
Across the Atlantic, a surprise economic report this week raises the likelihood that the Bank of England (BoE) may leave interest rates on hold next week. In the clearest signal so far of a boost for the economy since Boris Johnson’s decisive election victory last month, January’s flash IHS Markit / CIPS Composite Purchasing Managers’ Index for the United Kingdom hit 52.4—a 3.1-point increase from December. Furthermore, numbers over 50 signify economic expansion rather than contraction. The composite reading exceeded expectations, and the strong performance is likely to stave off the prospect of an imminent rate cut by the BoE when its monetary policy committee meets later this month. IHS Markit chief economist Chris Williamson stated, “Output grew at the fastest rate for 16 months amid rising demand for both manufacturing and services, suggesting business is rebounding after declines seen late last year.”
France and the U.S. have formally declared a truce in their fight over digital taxation after the U.S. dropped its insistence that any international taxation agreement should be optional. Talks on the sidelines of the World Economic Forum in Davos between Bruno Le Maire, the French finance minister, and Steven Mnuchin, US Treasury secretary, resulted in a US pledge that its trade representative would suspend planned tariffs on $2.4bn of French goods. In return, France agreed to stop collecting its digital tax, although corporate liabilities will still be accrued.
Germany ran its biggest ever surplus last year, according to the country’s finance minister, hitting 13.5 billion euros ($15 billion USD) of income over expenditure. However, the economy grew just 0.6% according to Germany’s federal statistics office, Destatis. The apparent disconnect between the two numbers prompted criticism of the Bundestag for refusing to stimulate demand in its own country. Domestic pressure has been growing on Chancellor Angela Merkel’s government to start spending the cash on infrastructure and end its commitment to its “black zero” policy of maintaining a balanced budget.
In Asia, concerns are mounting over the economic toll the deadly outbreak of coronavirus in the central Chinese city of Wuhan will bring. Wuhan is a major transport hub and home to more than 11 million people. Public transport in and out of the city, as well as trains, planes, and ferries all ground to a halt this week as authorities placed the city on lockdown. The Economist Intelligence Unit estimated the virus could shave between 0.5 to 1 percentage point off China’s gross domestic product this year against the baseline forecast of 5.9%.
Japanese exports shrank for a 13th consecutive month, a further blow to the struggling economy. The 6.3% year-over-year fall in exports was worse than the 4.2% decline expected by economists. The reading followed a 7.9% year-over-year decline the previous month, Japan’s Ministry of Finance data showed. Analysts had expected the preliminary trade deal between the U.S. and China and Britain’s exit from the European Union would help ease worries over global trade and boost Japan’s economy. However, the latest data showed that only a modest slowing in the pace of contraction had occurred. Some analysts, like Takeshi Minami, the chief economist at Norinchukin Research Institute, believe the bottom should be reached in a just a few months. “Exports are likely to bottom out around this spring,” he wrote in a note to clients.
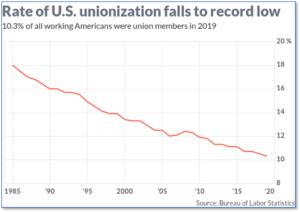
Finally: The U.S. Bureau of Labor Statistics (BLS) released its annual Union Membership report this week. It showed a continuation of the steep decline in union membership since 1983, the first year of the report. In 1983, there were 17.7 million unionized workers and the membership rate was 20.1% of the U.S. workforce. In 2019, there were 14.6 million and the membership rate was 10.3%, a reduction of almost half. Digging deeper, the BLS numbers reveal a stark contrast: unionization among public sector employees remains very high and stable at 33.6%, whereas unionization among private sector employees has plummeted to just a fifth of the public sector rate, at 6.2%. The public sector employees with the very highest rates of unionization are employees of local governments and districts: police, fire, and education. Lastly, more than half of all unionized workers in the U.S. are found in just 7 states: California, New York, Illinois, Pennsylvania, New Jersey, Ohio and Washington. Chart below from Marketwatch.com using BLS data.
All index- and returns-data from Yahoo Finance; news from Reuters, Barron’s, Wall St. Journal, Bloomberg.com, ft.com, guggenheimpartners.com, zerohedge.com, ritholtz.com, markit.com, financialpost.com, Eurostat, Statistics Canada, Yahoo! Finance, stocksandnews.com, marketwatch.com, wantchinatimes.com, BBC, 361capital.com, pensionpartners.com, cnbc.com, FactSet) Securities offered through Registered Representatives of Cambridge Investment Research Inc., a broker-dealer, member FINRA/SIPC. Advisory Services offered through Cambridge Investment Research Advisors, a Registered Investment Adviser. Strategic Investment Partners and Cambridge are not affiliated.
Indices mentioned are unmanaged and cannot be invested into directly. Past performance is no guarantee of future results. All Investing involves risk. Depending on the types of investments, there may be varying degrees of risk. Investors should be prepared to bear loss, including total loss of principal.