
2-10-20 Weekly Market Update
The Very big Picture (a historical perspective):
The long-term valuation of the market is commonly measured by the Cyclically Adjusted Price to Earnings ratio, or “CAPE”, which smooths-out shorter-term earnings swings in order to get a longer-term assessment of market valuation. A CAPE level of 30 is considered to be the upper end of the normal range, and the level at which further PE-ratio expansion comes to a halt (meaning that further increases in market prices only occur as a general response to earnings increases, instead of rising “just because”). The market is currently at that level.
Of course, a “mania” could come along and drive prices higher – much higher, even – and for some years to come. Manias occur when valuation no longer seems to matter, and caution is thrown completely to the wind – as buyers rush in to buy first, and ask questions later. Two manias in the last century – the “Roaring Twenties” of the 1920s, and the “Tech Bubble” of the late 1990s – show that the sky is the limit when common sense is overcome by a blind desire to buy. But, of course, the piper must be paid, and the following decade or two were spent in Secular Bear Markets, giving most or all of the mania-gains back.
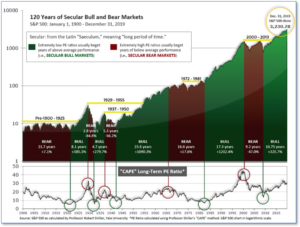
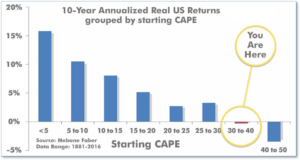
See Fig. 1 for the 100-year view of Secular Bulls and Bears. The CAPE is now at 31.82, up from the prior week’s 30.84, above the level reached at the pre-crash high in October, 2007. Since 1881, the average annual return for all ten-year periods that began with a CAPE around this level have been flat to slightly-negative (see Fig. 2).
In the Big Picture:
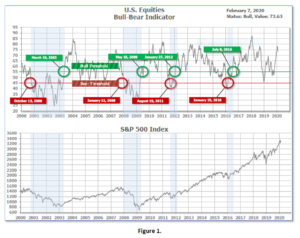
The ‘big picture’ is the (typically) years-long timeframe – the timeframe in which Cyclical Bulls and Bears operate. The U.S. Bull-Bear Indicator (Fig. 1) is in Cyclical Bull territory at 73.63, up from the prior week’s 77.57.
In the Intermediate and Shorter-term Picture:
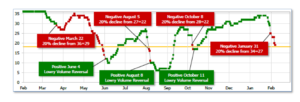
The Shorter-term (weeks to months) Indicator (see Fig. 4) is Negative. The indicator ended the week at 19, down from the prior week at 25. Separately, the Intermediate-term Quarterly Trend Indicator – based on domestic and international stock trend status at the start of each quarter – was positive entering January, indicating positive prospects for equities in the first quarter of 2020.
The complete Picture:
Counting up the number of all our indicators that are ‘Up’ for U.S. Equities, we are in ‘Mostly Positive’ territory (See Fig 3). This status is drawn from a scale that goes from Negative, to Mostly Negative, to Neutral, to Mostly Positive, to Positive, and totals-up current readings based on a multitude of timeframes (days/weeks/months/quarters/years, the ‘years’ being the Cyclical Bull or Bear reading).
In the Markets:
U.S. Markets: U.S. stocks recorded solid gains as encouraging economic data poured in and it appears, that at least for now, the global economy remains resilient in the face of the coronavirus outbreak. The large cap benchmarks and the technology-heavy NASDAQ Composite gained the most, establishing new record highs, while smaller cap indexes also finished to the upside. The Dow Jones Industrial Average rallied 846 points to finish the week at 29,102, a gain of 3.0%. The NASDAQ Composite surged over 4.0%, while the large cap S&P 500 index rose 3.2%. The S&P 400 mid cap index and small cap Russell 2000 rose 2.1% and 2.7%, respectively.
International Markets: Almost all major international markets finished in the green. Canada’s TSX rebounded 2.0%, while the United Kingdom’s FTSE 100 rose 2.5%. On Europe’s mainland, France’s CAC 40 gained 3.9%, Germany’s DAX added 4.1%, and Italy’s Milan FTSE gained 5.3%. In Asia, China’s Shanghai Composite ended the week down -3.4%, a smaller loss than many analysts had expected. At one point last week, China’s benchmark index had been down almost ‑10%. Japan’s Nikkei retraced the prior week’s entire decline, and finished the week up 2.7%. As grouped by Morgan Stanley Capital International, developed markets finished the week up 2.2%, while emerging markets gained 3.0%.
Commodities: Gold had its first down week out of the last three as equity markets regained upside momentum. Gold finished the week down -0.9% to $1573.40 per ounce. Silver, which has been notably weaker than gold recently, also finished the week down, losing -1.8% to $17.69 per ounce. The industrial metal copper managed a slight rebound from last week’s plunge, finishing up 1.4%. Copper is frequently used by analysts as a “barometer” of world economic health due to its wide variety of industrial uses. Oil fell for a fifth consecutive week, giving up -2.4% to close at $50.32 per barrel of West Texas Intermediate crude oil.
U.S. Economic News: The number of Americans seeking first-time unemployment benefits fell last week back to a near 50-year low, signaling the U.S. labor market is still holding up despite stiffer economic headwinds. The Labor Department reported initial jobless claims declined by 15,000 to 202,000. Economists had expected a reading of 215,000. The less volatile monthly average of jobless claims dropped by 3,000 to 211,750.
The Bureau of Labor Statistics’ Non-Farm Payrolls (NFP) report for January shocked all observers. The U.S. added 225,000 new jobs in January as hiring increased again. The report reflected the resilience in the U.S. labor market even though manufacturing has been in contraction and the economy has softened recently. Over the past three months, the economy has added an average of 211,000 new jobs—a marked acceleration from last fall and summer. The unemployment rate, meanwhile, ticked up to 3.6% from a 50-year low of 3.5%, but the increase was for the best of reasons: 574,000 more workers entered the labor force. An ultra-tight labor market has put more upward pressure on wages, though paychecks are still not growing as fast as they usually do when unemployment is so low. The increase in worker pay over the past 12 months rose slightly to 3.1%, but it sits below the post-recession peak of 3.5%.
Private payrolls processor ADP reported non-government payrolls surged 291,000 last month. It was the biggest monthly gain since May 2015 and, like the government’s NFP report, much higher than the consensus estimates. Service payrolls jumped 237,000, led by leisure-and-hospitality and health care. Those two industries accounted for over 60% of the services job gain. Goods-producing payrolls increased by 54,000, led by construction. Mark Zandi, chief economist at Moody’s Analytics stated that warm weather had “juiced” the number. By firm size, more than ¾ of all new jobs were created at small and mid-sized firms, with small firm employment rising by the most since July 2018.
The Institute for Supply Management (ISM) reported its survey of the services side of the economy, which makes up more than 70% of the U.S. economy, increased to a 5-month high in January. ISM reported its non-manufacturing index increased 0.6 point to 55.5. Economists had expected a reading of 55.0. The increase was led by a 3.9 point jump in the business activity index to 60.9—its highest level in nearly a year. Readings over 50 are viewed as positive for the economy, while anything over 55 is considered exceptional. Of the 18 industries ISM tracks, 12 reported businesses were expanding. One caveat, however, analysts noted the survey responses were likely filled out before the Wuhan coronavirus outbreak began having a substantial impact.
In a separate report, ISM said manufacturers grew their businesses in January for the first time in six months. ISM’s Manufacturing Index rebounded 3.1 points in January to 50.9. The consensus was for a smaller 0.7 point gain to 48.5. Overall, the increase was a welcome sign for a sector that’s been hit particularly hard by trade tensions and slower global growth. Most of the components of the manufacturing index increased in January, led by a 9.5-point surge in the production index. New orders, export orders, and imports also rebounded into expansion territory (>50), a sign of some improvement in both domestic and global demand.
International Economic News: The Canadian economy added 34,500 jobs in January, fueled by gains in the manufacturing, construction and agriculture industries. Economists had expected an increase of only 15,000 jobs. The increase came as the unemployment rate fell 0.1% to 5.5%. Bank of Montreal chief economist Doug Porter said underlying job growth appears to be on track following a brief scare late last year, and conditions remain tight. “While the Bank of Canada is clearly on high alert over the potential economic implications of the new coronavirus, recent indicators suggest the economy had decent underlying momentum at the start of the year,” Porter said.
British Finance Minister Sajid Javid’s goal of doubling the pace of the United Kingdom’s economic growth has just a one-in-five chance of success, said Britain’s National Institute of Economic and Social Research (NIESR). The think tank cited the country’s chronic run of poor productivity for the low rating. Javid has said he wants to raise the underlying pace of economic growth to 2.75% a year – a rate last achieved in 2006. The NIESR said in a report this week that such an acceleration would be difficult. “The chancellor’s aim of raising growth towards the post-war average of nearly 3% is quite unrealistic,” Arno Hantzsche, principal economist at NIESR stated. To get there, growth in output per hour would need to average around 2.5% per year. Official data shows it has taken the last 12 years to raise productivity by that much.
According to the international bank HSBC, the Eurozone could be at a “turning point” for economic activity. Eurozone gross domestic product growth surprised markets to the downside in the fourth quarter, rising by just 0.1% – its slowest pace of growth in almost seven years. On the individual country level, the French and Italian economies contracted in the fourth quarter, while Europe’s largest economy Germany sharply disappointed coming in at -3.5%. Furthermore, analysts don’t expect the European Central Bank (ECB) to provide much assistance. HSBC Senior European Economist Fabio Balboni stated the latest lending survey from the ECB indicated loan growth to firms appears to have peaked, including in Germany and France.
China is tapping all available monetary and fiscal tools to blunt the impact of the coronavirus outbreak on the economy. China has already injected 1.7 trillion yuan of liquidity into financial markets in the two days after its stock market reopened following the Lunar New Year. Furthermore, a deputy governor at the People’s Bank of China signaled that the loan prime rate would likely be cut at the next announcement on February 20. The government has also set up a 300 billion yuan credit facility for producers of masks and other designated items, enabling them to borrow money at a subsidized effective rate of 1.6% or less.
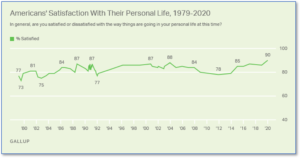
Finally: Although you wouldn’t know it from the unhappy picture of life in the United States painted in recent debates by Democratic presidential hopefuls, a recent Gallup poll found that nine out of ten Americans are satisfied with the way things are going in their personal lives. This is a new high in this survey’s forty-plus year history, exceeding the previous high of 88% recorded in 2003. Gallup found that household income, political party affiliation, and marital status were all associated with the largest differences in personal life satisfaction. As might be expected, high incomes were associated with higher levels of satisfaction, but even middle-income ($40k – $99k household income) Americans reported a very high 92% satisfaction, and the lower income tier of <$40k reported a decent 80% satisfaction with their personal lives. (Chart below from Gallup)
(Sources: All index- and returns-data from Yahoo Finance; news from Reuters, Barron’s, Wall St. Journal, Bloomberg.com, ft.com, guggenheimpartners.com, zerohedge.com, ritholtz.com, markit.com, financialpost.com, Eurostat, Statistics Canada, Yahoo! Finance, stocksandnews.com, marketwatch.com, wantchinatimes.com, BBC, 361capital.com, pensionpartners.com, cnbc.com, FactSet) Securities offered through Registered Representatives of Cambridge Investment Research Inc., a broker-dealer, member FINRA/SIPC. Advisory Services offered through Cambridge Investment Research Advisors, a Registered Investment Adviser. Strategic Investment Partners and Cambridge are not affiliated.
Indices mentioned are unmanaged and cannot be invested into directly. Past performance is no guarantee of future results. All Investing involves risk. Depending on the types of investments, there may be varying degrees of risk. Investors should be prepared to bear loss, including total loss of principal.