
2-28-2022 Weekly Market Update
The very Big Picture
The long-term valuation of the market is commonly measured by the Cyclically Adjusted Price to Earnings ratio, or “CAPE”, which smooths-out shorter-term earnings swings in order to get a longer-term assessment of market valuation. A CAPE level of 30 is considered to be the upper end of the normal range, and the level at which further PE-ratio expansion comes to a halt (meaning that further increases in market prices only occur as a general response to earnings increases, instead of rising “just because”). The market is now above at that level.
Of course, a “mania” could come along and drive prices higher – much higher, even – and for some years to come. Manias occur when valuation no longer seems to matter, and caution is thrown completely to the wind – as buyers rush in to buy first, and ask questions later. Two manias in the last century – the “Roaring Twenties” of the 1920s, and the “Tech Bubble” of the late 1990s – show that the sky is the limit when common sense is overcome by a blind desire to buy. But, of course, the piper must be paid, and the following decade or two were spent in Secular Bear Markets, giving most or all of the mania-gains back.
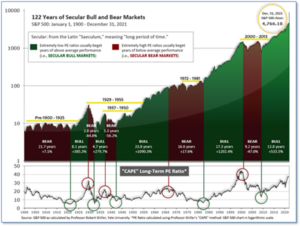
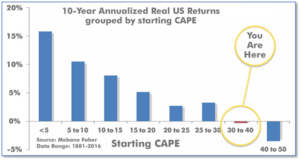
See Fig. 1 for the 100-year view of Secular Bulls and Bears. The CAPE is now at 35.89, up from the prior week’s 35.59. Since 1881, the average annual return for all ten-year periods that began with a CAPE in this range has been negative (see Fig. 2).
Note: We do not use CAPE as an official input into our methods. However, if history is any guide – and history is typically ‘some’ kind of guide – it’s always good to simply know where we are on the historic continuum, where that may lead, and what sort of expectations one may wish to hold in order to craft an investment strategy that works in any market ‘season’ … whether the current one, or one that may be ‘coming soon’!
The Big Picture:
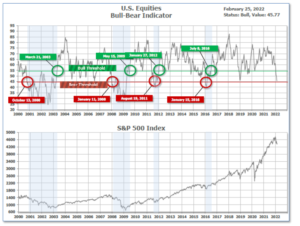
The ‘big picture’ is the (typically) years-long timeframe – the timeframe in which Cyclical Bulls and Bears operate. The U.S. Bull-Bear Indicator is in Cyclical Bull territory at 45.77, down from the prior week’s 46.18 and getting very close to the bear threshold of 45.00.
In the Quarterly- and Shorter-term Pictures
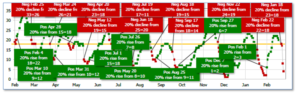
The Quarterly-Trend Indicator based on the combination of U.S. and International Equities trend-statuses at the start of each quarter – was Positive entering January, indicating positive prospects for equities in the fourth quarter of 2021.
Next, the short-term(weeks to months) Indicator for US Equities turned negative on February 22, and ended the week at 4, down sharply from the prior week’s 20.
In the Markets:
U.S. Markets: The major U.S. indexes finished the week mostly higher after a holiday-shortened week of historic volatility. On Thursday, the Nasdaq Composite Index had an intraday swing of 6.8%, the largest intraday range since the World Health Organization declared the start of the coronavirus in March 2020. The Dow Jones Industrial Average ended the week down just 20 points to 34,059, a decline of -0.1%. The Nasdaq rebounded after two weeks of declines closing up 1.1% to 13,695. By market cap, the large cap S&P 500 finished up 0.8%, the mid cap S&P 400 gained 1.1%, and the small cap Russell 2000 rallied the most, finishing up 1.6%.
International Markets: Major international markets finished the week predominantly to the downside. Canada’s TSX managed a 0.5% gain, but the United Kingdom’s FTSE 100 shed -0.3%. France’s CAC 40 and Germany’s DAX declined -2.6% and -3.2%, respectively, while in Asia China’s Shanghai Composite finished down -1.1%. Japan’s Nikkei finished down -2.4%. As grouped by Morgan Stanley Capital International, developed markets finished the week down ‑0.9%, while emerging markets retreated -2.8%.
Commodities: Precious metals ended the week mixed with Gold retreating -0.6% to $1887.60 per ounce and Silver gaining 0.1% to $24.02. Crude oil finished the week up following last week’s decline. West Texas Intermediate crude oil rose 1.5% to $91.59 per barrel. The industrial metal copper, viewed by some analysts as a barometer of world economic health due to its wide variety of uses, ended the week down -0.8%.
U.S. Economic News: The number of Americans filing first-time unemployment benefits continued to decline last week, as the labor market remains remarkably robust. The Labor Department reported initial jobless claims fell by 17,000 to 232,000 in the week ended February 19th. Economists had estimated new claims would slip to 235,000. Continuing claims, which counts the number of Americans already receiving benefits, fell by 112,000 to 1.48 million. Continuing claims are at their lowest level since March of 1970. Overall, the labor market remains tight, and most economists believe claims will continue to move lower.
Home prices rose at their fastest rate in 34 years in December, but economists don’t expect the pace to continue as interest rates begin to rise. The S&P CoreLogic/Case-Shiller 20-city home price index posted an 18.6% year-over-year gain in December, up 0.3% from the previous month. On a monthly basis, the index increased 1.5% between November and December. On a national level, the Case-Shiller home price index rose 18.8% on an annual basis—in line with November. Craig J. Lazzara, managing director at S&P DJI, said in the report, “This is the highest calendar year increase in 34 years of data, and substantially ahead of 2020’s 10.4% gain.” Phoenix recorded the highest rate of home-price growth in the country in December with a 32.5% year-over-year increase. As with the month prior, two Florida cities closely followed: Tampa with a 29.4% gain and Miami with a 27.3% rise.
The torrid increase in home prices may finally be taking a toll, according to a preliminary indicator of the housing market. The National Association of Realtors (NAR) reported pending home sales fell a sharp 5.7% last month. Pending home sales data shows transactions in which a contract has been signed but not yet closed. Economists had expected pending home sales to rise 1%. This is the third straight monthly decline in the index for pending home sales. Year over year, pending home sales were down 9.5%. The West was the only region to see an increase in activity in January. All of the regions posted declines in activity compared with year-ago levels. The Federal Reserve’s sharp pivot towards a steady pace of interest rate hikes, higher inflation, and continuing lack of supply seem to be finally weighing on the nation’s home buyers.
The Federal Reserve’s “preferred” inflation gauge jumped again, as inflation rose at its fastest pace since 1982. The Personal Consumption Expenditures Index (PCEI) rose 0.6% in January and 6.1% over the past year. The more widely followed Consumer Price Index rose by an even higher 7.5% in the 12 months ended in January – also the largest move since 1982. A narrower measure of inflation that omits volatile food and energy costs, known as the core PCE, rose by 0.5% in January. The Fed views the PCE index — the core rate in particular — as the most accurate measure of U.S. inflation. It’s more comprehensive and takes into account when consumers substitute cheaper goods for more expensive ones, among other things. Chief economist Scott Brown of Raymond James wrote in a note, “Inflation has been largely concentrated in durables, but inflation in services has been picking up, which is worrisome for the Fed.”
Confidence among the nation’s consumers dipped this month as higher inflation weighed on sentiment. The Conference Board reported its Consumer Confidence index dropped 0.6 point to 110.5. Economists had expected the forecast to dip to 109.5. Lynne Franco, senior director of economic indicators at the board stated, “Consumers remain relatively confident about short-term growth prospects. While they do not expect the economy to pick up steam in the near future, they also do not foresee conditions worsening.” While the smaller-than-expected decline in consumer confidence was a good sign in the report, respondents stated they were worried about high inflation. Fewer people plan to buy homes, cars, autos and appliances in the next six months, the survey found.
Data analytics firm IHS Markit reported the U.S. economy accelerated in February, according to both its services and manufacturing surveys. Markit stated its preliminary, or “flash”, index of service-oriented companies jumped 5.6 points to 56.7 this month, from an 18-month low in January. Similarly, its gauge of manufacturing companies rose 2 points to 57.5. Service-oriented companies and manufacturers alike boosted production in February to keep up with strong sales. The flash IHS surveys offer the first broad look at the performance of the U.S. economy each month. Readings above 50 means businesses are growing and numbers above 55 are especially robust.
International Economic News: Canada’s Prime Minister Justin Trudeau announced a new suite of “severe” sanctions against Russian entities after the invasion of neighboring Ukraine. The economic measures, which the government says were carefully coordinated with other G7 countries, are meant to hobble Russia’s economy as its forces push further into Ukraine. Trudeau called Russia’s act of war “a massive threat to security and peace around the world.” Trudeau said Canada will target 62 individuals and entities, including members of the Russian elite and their family members, the Russian paramilitary organization Wagner Group and major Russian banks. However, Mark Manger, an associate professor at the University of Toronto’s Munk School of Global Affairs & Public Policy pointed out there simply isn’t enough trade between the two countries for even broad sanctions to hurt Russia’s economy. “Our trade relationship with Russia is negligible. It’s about half a per cent,” Manger wrote.
Across the Atlantic, consumer confidence in the United Kingdom plunged in February as the cost of living surged. According to research company GfK, the consumer confidence index, a closely watched indicator of how people view the state of their personal finances and wider economic prospects fell seven points to -26 in February. It was the lowest score since January 2021 and one of the worst since the start of the pandemic. Joe Staton, client strategy director at GfK stated, “Fear about the impact of price rises from food to fuel and utilities, increased taxation and interest rate hikes has created a perfect storm of worries that has shaken consumer confidence.” And the outlook looks even more dismal. Respondents’ views on their personal financial situation for the year ahead fell 12 points to -14—the worst reading since April 2020 at the height of the first lockdown.
On Europe’s mainland, French Economy and Finance Minister Bruno Le Maire and his German counterpart Christian Linder stated the European Union wants to isolate Russia financially and cut all links between Russia and the global financial system. The comments were made at a European Union finance ministers meeting this week. The bloc agreed on new sanctions against Moscow over its attack on Ukraine. Le Maire said Moscow was “an economic partner of secondary importance” for France. However, his German counterpart Christian Lindner spelled out that “in one-off cases, payments (to Russia) remain possible, for example to pay for gas deliveries”. Germany is highly dependent upon Russian natural gas, especially since the recent mothballing of several nuclear power plants in a “green” push.
In Asia, China may be the economic lifeline for Russia as it faces growing isolation over its invasion of Ukraine. As much of the international community rolls out sanctions against Moscow, Beijing has emerged as a key player with the potential to mitigate the economic damage and undermine the pressure campaign. This week, Chinese customs authorities announced the lifting of import restrictions on Russian wheat, which makes up more than one-quarter of the global supply. Alicia García Herrero, chief economist for Asia Pacific at Natixis stated, “That’s a signal of support. The other thing that China has done is to really make very clear that sanctions are ineffective and are not warranted.”
Japan’s Prime Minister Fumio Kishida unveiled a set of tighter Japanese sanctions against Russia featuring a freeze on assets held by Russian banks and curbs on exports to military-linked groups in response to Moscow’s invasion of Ukraine. The new sanctions package also includes export controls on semiconductors and other high-tech products, as well as a suspension of visa issuance for certain Russian individuals and entities, Kishida said. The asset freeze will target three financial entities–Promsvyazbank, Bank Rossiya and Russia’s economic development bank VEB. Condemning the Russian military attack as being in violation of international law, the prime minister said, “Japan needs to show its resolve not to allow any change to the status quo by force.”
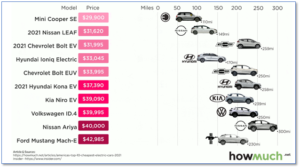
Finally: So just how far can America’s top 10 cheapest electric cars go on a single charge? Financial website HowMuch.net found the average distance most electric cars can travel per charge is around 220 miles, but with a wide variation. For purposes of their comparison, “cheapest” means an average cost between roughly $30,000 and $40,000. The Ford Mustang Mach-E tops the list as the most expensive electric car at $42,985 but travels only about 230 miles. The Nissan Ariya traveled the farthest–300 miles–and came in at $40,000. At the other end, the Mini Cooper SE was both the cheapest and the one with the smallest range of 110 miles. (Chart from howmuch.net)
(Sources: All index- and returns-data from Yahoo Finance; news from Reuters, Barron’s, Wall St. Journal, Bloomberg.com, ft.com, guggenheimpartners.com, zerohedge.com, ritholtz.com, markit.com, financialpost.com, Eurostat, Statistics Canada, Yahoo! Finance, stocksandnews.com, marketwatch.com, wantchinatimes.com, BBC, 361capital.com, pensionpartners.com, cnbc.com, FactSet.) Securities offered through Registered Representatives of Cambridge Investment Research Inc., a broker-dealer, member FINRA/SIPC. Advisory Services offered through Cambridge Investment Research Advisors, a Registered Investment Adviser. Strategic Investment Partners and Cambridge are not affiliated. Indices mentioned are unmanaged and cannot be invested into directly. Past performance is no guarantee of future results.