
2-21-2022 Weekly Market Update
The very Big Picture
The long-term valuation of the market is commonly measured by the Cyclically Adjusted Price to Earnings ratio, or “CAPE”, which smooths-out shorter-term earnings swings in order to get a longer-term assessment of market valuation. A CAPE level of 30 is considered to be the upper end of the normal range, and the level at which further PE-ratio expansion comes to a halt (meaning that further increases in market prices only occur as a general response to earnings increases, instead of rising “just because”). The market is now above at that level.
Of course, a “mania” could come along and drive prices higher – much higher, even – and for some years to come. Manias occur when valuation no longer seems to matter, and caution is thrown completely to the wind – as buyers rush in to buy first, and ask questions later. Two manias in the last century – the “Roaring Twenties” of the 1920s, and the “Tech Bubble” of the late 1990s – show that the sky is the limit when common sense is overcome by a blind desire to buy. But, of course, the piper must be paid, and the following decade or two were spent in Secular Bear Markets, giving most or all of the mania-gains back.
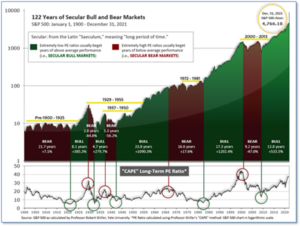
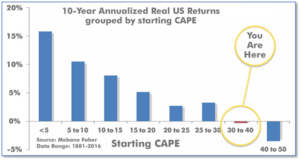
See Fig. 1 for the 100-year view of Secular Bulls and Bears. The CAPE is now at 35.59, down from the prior week’s 36.17. Since 1881, the average annual return for all ten-year periods that began with a CAPE in this range has been negative (see Fig. 2).
Note: We do not use CAPE as an official input into our methods. However, if history is any guide – and history is typically ‘some’ kind of guide – it’s always good to simply know where we are on the historic continuum, where that may lead, and what sort of expectations one may wish to hold in order to craft an investment strategy that works in any market ‘season’ … whether the current one, or one that may be ‘coming soon’!
The Big Picture:
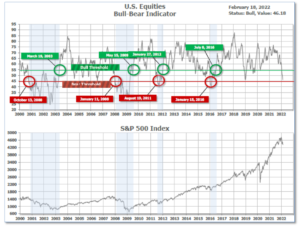
The ‘big picture’ is the (typically) years-long timeframe – the timeframe in which Cyclical Bulls and Bears operate. The U.S. Bull-Bear Indicator is in Cyclical Bull territory at 46.18, down from the prior week’s 48.73 and getting very close to the bear threshold of 45.00.
In the Quarterly- and Shorter-term Pictures
The Quarterly-Trend Indicator based on the combination of U.S. and International Equities trend-statuses at the start of each quarter – was Positive entering January, indicating positive prospects for equities in the fourth quarter of 2021.
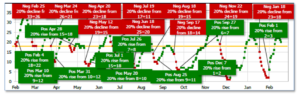
Next, the short-term(weeks to months) Indicator for US Equities turned positive on February 1, and ended the week at 20, down from the prior week’s 22.
In the Markets:
U.S. Markets: The large-cap benchmarks experienced their second consecutive week of declines as worries over conflict in the Ukraine and high inflation continued to weigh on investor sentiment. The Dow Jones Industrial Average shed 659 points finishing the week at 34,079 – a decline of -1.9%. The technology-heavy NASDAQ Composite ended the week down -1.8% to 13,548. By market cap, the large-cap S&P 500 gave up -1.6%. The mid-cap S&P 400 and small-cap Russell 2000 ended down -0.6% and -1%, respectively.
International Markets: Major international markets finished the week predominantly to the downside as well. Canada’s TSX pulled back -2.5%, while the United Kingdom’s FTSE 100 fell -1.9%. On Europe’s mainland, France’s CAC 40 retreated -1.2% and Germany’s DAX ended down -2.5%. In Asia, China’s Shanghai Composite gained 0.8%. Japan’s Nikkei 225 declined -2.1%. As grouped by Morgan Stanley Capital International, developed markets fell -0.5%, although emerging markets remained unchanged.
Commodities: Precious metals continued their rise with the help of weakness in equities markets and geopolitical risk. Gold rose more than 3.1% to $1899.80 per ounce, while Silver gained 2.7% to $23.99. Energy pulled back following eight consecutive weeks of gains. West Texas Intermediate crude oil retreated -3.1% to $90.21 per barrel. The industrial metal copper, viewed by some analysts as a barometer of world economic health due to its wide variety of uses, finished the week up 0.3%.
U.S. Economic News: The number of Americans filing first-time unemployment benefits jumped last week to a three-week high, but economists say not to worry. The Labor Department reported new applications for unemployment benefits jumped by 23,000 to 248,000 last week, but layoffs are expected to stay low as companies strive to fill a nearly 11 million job openings. Mahir Rasheed, U.S. economist at Oxford Economics wrote, “Despite the uptick, we expect initial claims to continue to grind back toward 200,000.” Layoffs are expected to be minimal in a tight labor market where employers continue to face difficulty hiring workers. ”Economists had expected new claims to total 218,000. Meanwhile, the number of people already collecting benefits dropped by 26,000 to 1.59 million. That number is reported with a one-week delay.
Confidence among the nation’s homebuilders pulled back in February, according to the National Association of Home Builders (NAHB). The NAHB’s monthly confidence index dropped one point to 82 in February. It was the index’s second consecutive decline. The decline matched economists’ forecasts. Despite the slight pullback, the overall index remains strong—readings over 50 signify improving confidence. The sub-index that measures sentiment regarding sales over the next 6 months fell two points to 80, while the gauge regarding prospective buyers slipped four points to 69. On a regional basis, attitudes among home builders improved in the Northeast and West, but worsened in the Midwest and South. Supply chain issues continue to weigh on builders. NAHB chairman Jerry Konter noted in the report that “that many builders are waiting months to receive cabinets, garage doors, countertops and appliances.”
Sales of existing homes continued to surge higher, but rising rates are likely to stifle future demand. The National Association of Realtors (NAR) reported existing-home sales surged nearly 7% between December and January. Unsold inventory dropped to just a 1.6 month supply—a record low. A 6-month supply of homes is generally considered a “balanced” housing market. As of January, the median sales price for an existing home was up 15% on an annual basis to $350,300. Regionally, sales increased in January in every part of the country, led by a more than 9% surge in the South. Additionally, the South experienced the fastest pace of home-price appreciation in the country.
Sales at the nation’s retailers jumped 3.8% in January as Americans spent more money on just about everything. The increase in sales was the largest since last March, when consumers spent a good chunk of their stimulus money from the government. Economists had forecast a 2.1% gain. Some economists warned against extrapolating too much from the strong January retail report. They noted that sales snapped back from a steep 2.5% drop in December. Furthermore, retail sales have shown a pattern of surging in January after declining in December going back about 5 years. Sales jumped 5.7% at car dealers in January. Auto sales account for about one-fifth of overall retail spending. Sales also rose sharply at internet retailers (14.5%), furniture stores (7.2%), department stores (9.2%) and home centers (4.1%).
Prices at the producer level surged again as inflation continued to affect the U.S. economy at all levels. U.S. wholesale prices jumped 1% in January, doubling economists’ expectations of a 0.5% increase. The increase was the largest gain in a year. The cost of wholesale goods soared 1.3% last month, driven by increases in the cost of food, gasoline, beef and dairy. The cost of services rose 0.7% last month. Wholesale prices reflect what businesses pay for raw materials like grains, metals, lumber, and computer chips. Since companies often pass on higher prices they pay for materials to consumers, economists look at wholesale inflation numbers for an early indication of future consumer inflation. Over the past year, wholesale prices slowed a tick to 9.7%. Meanwhile, core wholesale inflation, which strips out the most volatile goods and services, rose 0.9% last month. That number was also well above Wall Street expectations.
Costs for imported goods jumped 2% in January – also adding to the strongest surge in U.S. inflation in 40 years. Higher oil prices led the way, but the increase was broad-based. Economists had expected a 1.2% gain. Excluding oil, import prices were still up 1.4% last month—the largest gain since the government began keeping records in 2002. Over the past year, import prices have climbed 10.8%, just below their pandemic peak. Meanwhile, U.S. export prices climbed 2.9% last month. Analysts note inflation is rising not only in the U.S. but around the world. Disruptions in supply chains have been tied to price pressures, but massive government stimulus and easy-money policies by the world’s central banks are named by many economists as the main culprits. Economists expect inflation to slow later in the year as bottlenecks in supply-chains unwind and central banks reverse their monetary policies.
International Economic News: Canada announced an ambitious plan to welcome more than 1.3 million immigrants over the next three years to support its economy. Prime Minister Justin Trudeau’s government is working to add 431,000 new residents this year, and over 400,000 each year for the next two years according to the 2022-2024 Immigration Levels Plan released this week. “Immigration has helped shape Canada into the country it is today,” Immigration Minister Sean Fraser said in a statement. “We are focused on economic recovery, and immigration is the key to getting there.” People from India make up the biggest nationality gaining permanent residency in Canada, accounting for about 40% of the total number. In 2022, some 56% of new immigrants will arrive under economic class pathways such as Express Entry, the Provincial Nominee Program, and the Temporary to Permanent Residence (TR2PR) stream that was available in 2021, according to reports.
Across the Atlantic, inflation in the United Kingdom rose at its fastest pace in almost 30 years, as increased costs for energy, housing and transportation squeezed household budgets. The UK’s consumer price index (CPI) ticked up to an annualized 5.5% in January, the Office for National Statistics reported. The latest reading is the highest since March 1992, when inflation hit 7.2%. Energy prices have hit the UK particularly hard. Household natural gas prices jumped 28.3% over the past year, while electricity prices rose 19.2%. The pain is only expected to get worse for British consumers. The nation’s energy regulator has announced a 54% increase in gas and electricity taxes that will hit 15 million households in April.
On Europe’s mainland, French wine exports hit a record high as global economies recover and trade tensions ease. Exports of French wine and spirits jumped to a record high of 4.9 billion euros ($5.5 billion USD) in 2021. According to the Fédération des Exportateurs de Vins & Spiritueux de France (FEVS), French spirits exports rose by 30.1%. FEVS said the trade balance totaled $16.1 billion, confirming the wines and spirits industry had the second largest trade surplus, behind aircraft. “This positive result in 2021 is remarkable,” said FEVS chairman César Giron. “Despite remaining health, logistical and geopolitical constraints, French wines and spirits companies have shown both their willingness and their ability to bounce back in the different parts of the world.”
German Foreign Minister Annalena Baerbeck said all options are on the table regarding sanctions on Russia in the event it attacks Ukraine. In a speech at the Munich Security Conference this week, Baerbock said Western powers are united in their preparation of “unprecedented sanctions” on Russia. “We, Germany, are prepared to pay a high economic price for this,” she said. “That’s why all options are on the table.” Baerbeck’s comments undoubtedly referenced the vital Russian gas pipeline Nord Stream 2. Despite the lack of a Russian delegation at the security summit for the first time in decades, Baerbock sent a message to the Kremlin: security cannot come at the cost of others, she said.
In Asia, the vast majority of people in Southeast Asia see China as topping the U.S. as an economic power in the region, an ISEAS-Yusof Ishak Institute survey found. The survey showed 76.6% of SE Asians believe China is the most influential economic power in the region. The U.S. was a distant second at just 9.8%. The survey said although the U.S. number is low, it is a significant improvement from last year, when it was 6.6%. The improvement was seen primarily in Malaysia, Myanmar, the Philippines, Singapore and Thailand. While regional countries see China as the top economic power, they also fear the amount of economic control China will exert on their countries. In the survey, 64.4% worried about China’s economic influence, while 35.6% thought Beijing’s economic exertion on the countries was a good thing.
Japan’s economy grew at an annual rate of 5.4% in the final quarter of last year, boosted by improved consumer spending and exports, the government reported. On a quarterly basis, Japan’s real gross domestic product, or GDP, grew 1.3%, according to Cabinet Office data. Growth got a boost after measures to curb the spread of coronavirus infections were lifted last year. For all of 2021, the world’s third-largest economy grew 1.7%, marking its first calendar year expansion in three years.
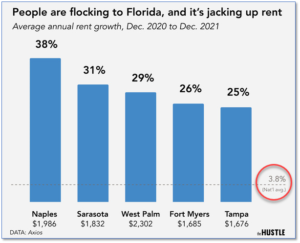
Finally: According to the Bureau of Labor Statistics’ Consumer Price Index (CPI), rents rose 3.8% across the country last year. But one state in particular scored six of the top ten cities with the highest average rent increase. According to Axios, a few factors explain the increase. More workplaces allowing remote work has pushed workers to warmer climates, and with more housing demand some residents are choosing to rent instead. Furthermore, many residents of higher-tax restrictive states are choosing the low taxes and freedom of states like Florida. (Data: Axios; Chart: TheHustle.co)
(Sources: All index- and returns-data from Yahoo Finance; news from Reuters, Barron’s, Wall St. Journal, Bloomberg.com, ft.com, guggenheimpartners.com, zerohedge.com, ritholtz.com, markit.com, financialpost.com, Eurostat, Statistics Canada, Yahoo! Finance, stocksandnews.com, marketwatch.com, wantchinatimes.com, BBC, 361capital.com, pensionpartners.com, cnbc.com, FactSet.) Securities offered through Registered Representatives of Cambridge Investment Research Inc., a broker-dealer, member FINRA/SIPC. Advisory Services offered through Cambridge Investment Research Advisors, a Registered Investment Adviser. Strategic Investment Partners and Cambridge are not affiliated. Indices mentioned are unmanaged and cannot be invested into directly. Past performance is no guarantee of future results.