
2-20-2023 Weekly Market Update
The very Big Picture
The long-term valuation of the market is commonly measured by the Cyclically Adjusted Price to Earnings ratio, or “CAPE”, which smooths-out shorter-term earnings swings in order to get a longer-term assessment of market valuation. A CAPE level of 30 is considered to be the upper end of the normal range, and the level at which further PE-ratio expansion comes to a halt (meaning that further increases in market prices only occur as a general response to earnings increases, instead of rising “just because”). The market was recently above that level, and has fallen back.
Of course, a “mania” could come along and drive prices higher – much higher, even – and for some years to come. Manias occur when valuation no longer seems to matter, and caution is thrown completely to the wind – as buyers rush in to buy first, and ask questions later. Two manias in the last century – the “Roaring Twenties” of the 1920s, and the “Tech Bubble” of the late 1990s – show that the sky is the limit when common sense is overcome by a blind desire to buy. But, of course, the piper must be paid, and the following decade or two were spent in Secular Bear Markets, giving most or all of the mania-gains back.
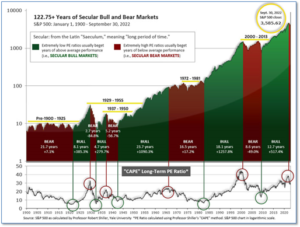
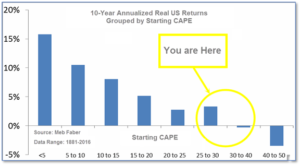
See Fig. 1 for the 100-year view of Secular Bulls and Bears. The CAPE is now at 29.63, down from the prior week’s 29.71. Since 1881, the average annual return for all ten-year periods that began with a CAPE in this range has been slightly positive to slightly negative (see Fig. 2).
Note: We do not use CAPE as an official input into our methods. However, if history is any guide – and history is typically ‘some’ kind of guide – it’s always good to simply know where we are on the historic continuum, where that may lead, and what sort of expectations one may wish to hold in order to craft an investment strategy that works in any market ‘season’ … whether the current one, or one that may be ‘coming soon’!
The Big Picture:
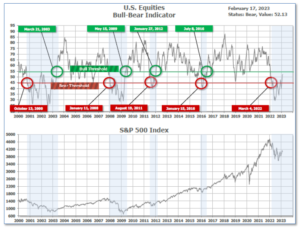
The ‘big picture’ is the (typically) years-long timeframe – the timeframe in which Cyclical Bulls and Bears operate. The U.S. Bull-Bear Indicator finished the week in Bear territory at 52.13, up from the prior week’s 52.02.
In the Quarterly- and Shorter-term Pictures
The Quarterly-Trend Indicator based on the combination of U.S. and International Equities trend-statuses at the start of each quarter – was Positive entering January, indicating positive prospects for equities in the first quarter of 2023.
Next, the short-term(weeks to months) Indicator for US Equities turned positive on January 6, and ended the week at 31, down from the prior week’s 33.
In the Markets:
U.S. Markets: The major U.S. indexes ended the week mixed as investors weighed some positive economic and earnings reports against worries that inflation may be taking an unfavorable turn. Fears that the Federal Reserve would need to raise short-term interest rates more than previously expected caused U.S. Treasury yields to increase and fostered a rise in the U.S. dollar, taking an especially large toll on oil prices and energy stocks. The Dow Jones Industrial Average shed 43 points finishing the week at 33,827—a decline of -0.1%. The technology-heavy NASDAQ Composite rebounded 0.6% to 11,787. By market cap, the large cap S&P 500 pulled back -0.3%, while the mid cap S&P 400 and small cap Russell 2000 added 1.0% and 1.4% respectively.
International Markets: International markets were mixed like the U.S. Canada’s TSX and the UK’s FTSE pulled back -0.5% and -0.6%, while France’s CAC 40 jumped 3.1%. Germany’s DAX added 1.1%. China’s Shanghai Composite pulled back -1.1% and Japan’s Nikkei retreated -0.6%. As grouped by Morgan Stanley Capital International, developed markets added 0.5%. Emerging markets declined -1.3%.
Commodities: Gold and Silver finished the week in the red. Gold declined -1.3% to $1850.20 per ounce, while Silver retreated -1.6% to $21.71. West Texas Intermediate crude oil ended down as well declining -4% to $76.55 per barrel. The industrial metal copper, viewed by some analysts as a barometer of world economic health, finished the week up 2.3%.
U.S. Economic News: The U.S. labor market remains robust, according to the latest data from the Labor Department. The number of people who applied for unemployment benefits fell slightly last week to 194,000 and remained below the 200,000-level for the fifth week in a row. The number of people applying for jobless benefits is one of the best barometers of whether the economy is getting better or worse. New unemployment filings remain near historically low levels. Meanwhile, the number of people already collecting unemployment benefits, rose by 16,000 to a three-month high of 1.7 million. These so-called continuing claims are still low, but a gradual increase since last spring suggests it’s taking a bit longer for people who lose their jobs to find new ones.
Confidence among the nation’s small-business owners improved slightly in January as inflation pressures moderated, but overall remained subdued due to weak perceptions about the economic outlook. The National Federation of Independent Business (NFIB) said that its small-business optimism index increased to 90.3 in January from 89.8 in December, broadly in line with the 90.0 consensus forecast from economists. Despite the slight improvement, the index remains below its long-term average of 98. “While inflation is starting to ease for small businesses, owners remain cynical about future business conditions,” NFIB Chief Economist Bill Dunkelberg said. The NFIB survey provides a monthly snapshot of small businesses in the U.S., which account for nearly half of private sector jobs.
The National Association of Home Builders (NAHB) reported its monthly confidence index rose 7 points to 42 this month. This is the second month in a row of improvement and its largest increase since June 2013. A drop in mortgage rates boosted sentiment, despite builders continuing to deal with high construction costs and supply chain delays. The bump in confidence signals that “the housing market may be turning a corner,” the NAHB said. All three gauges that underpin the overall builder-confidence index rose for the second month in a row. The gauge that marks current sales conditions rose by 6 points. The component that assesses sales expectations for the next six months rose by 11 points. And the gauge that measures traffic of prospective buyers rose by 6 points. Builders in all four regions reported an increase in confidence led by the Northeast and South, where the index moved up 4 points, followed by the West and Midwest.
The cost of living rose 0.5% in January — its biggest increase in three months — in a sign that U.S. inflation is not slowing as quickly as hoped. Higher housing costs and gasoline prices accounted for most of the increase. Economists were expecting a 0.4% increase. In addition, the so-called ‘core rate’ of inflation, which omits food and energy, advanced 0.4% for the second consecutive month. That reading was also above its forecast of 0.3%. Meanwhile, the annual rate of inflation slowed to 6.4% from 6.5%, while the core rate tapered to 5.6% from 5.7%. Corporate economist Robert Frick of Navy Federal Credit Union wrote in a note, “No one said disinflation would be a smooth ride. January’s CPI was a bump in the road. The good news is that shelter costs, which accounted for about half the increase, should start dropping soon, putting inflation back on its downward path.”
At the wholesale level, prices surged again implying inflation is unlikely to ease quickly. The Producer Price Index jumped 0.7% last month—its biggest gain since last summer. The reading was almost double the consensus forecast of 0.4%. Over the past 12 months, wholesale prices have slowed to 6% from 6.5%, still that’s triple the Fed’s target for overall inflation. A separate measure of wholesale prices that strips out volatile food and energy costs climbed a sharp 0.6% last month. That was the largest increase in core prices in 10 months. In a bit of good news, the wholesale cost of food fell 1% to mark the second large decline in a row. Food prices also dropped 1% in December. “Both inflation readings this week point to the stickiness of inflation and that the fight isn’t over,” said Mike Loewengart, head of model portfolio construction Morgan Stanley Global Investment.
Sales at U.S. retailers jumped 3% in January — its biggest increase in almost two years — as Americans flocked to stores at the start of the new year. Sales of new vehicles and parts, a volatile category, jumped 5.9% last month—the biggest increase in 22 months. Receipts at gas stations were flat. Sales rose in all major categories, led by department stores which jumped almost 18%. Chief economist Eugenio Aleman of Raymond James noted the increase in January retail sales “was very strong, reversing the weakness seen during the last two months of last year. It sets the economy on a very strong path during the first quarter of the year.”
International Economic News: Canada’s capital city Ottawa has unveiled a new national agency with a mission of making Canadian businesses more innovative and productive. The Canada Innovation Corporation will support businesses across all sectors in developing and protecting intellectual property, as well as capturing segments of global supply chains, according to the ministries overseeing the project Finance Canada and ISED. Finance Minister Chrystia Freeland and Innovation Minister François-Philippe Champagne released the blueprint document providing details on how the organization will operate. “Canadian businesses do not invest in research and development at the same level as their global peers,” the document said, noting that this weakens Canada’s economic competitiveness and reduces opportunities for Canadian workers.
Across the Atlantic, the United Kingdom lost more working days to strikes in 2022 than in any year since 1989, as employees walked out in large numbers over pay amid soaring living costs. Figures from the Office for National Statistics (ONS) showed that nearly 2.5 million working days were lost to industrial action between June and December, the highest since 1989 when 4.1 million days were lost. The ONS said 843,000 working days were lost in December 2022 alone — the highest monthly number since November 2011.
On Europe’s mainland, most Germans are worried about high inflation, and more than half of them report that rising prices are making them struggle financially, an international survey by Dynata showed. According to the survey, 61% of German citizens are very or extremely concerned about rising prices for energy, food, gasoline and housing. Only 2% of the respondents said they were not concerned, and 37% were slightly or somewhat concerned. Prices in Germany relative to other European Union countries rose by 9.2% on the year in January, Germany’s statistics office showed. Out of those surveyed, 53% say that rising prices for everyday goods is leading to financial difficulties.
China’s economic recovery is off to a modest start, with preliminary data showing overall growth remains tepid. Official loan data for January showed year-on-year growth in loans to businesses, but a sharp drop in that to households. The latest data from Nomura shows road and subway traffic back to pre-pandemic levels, but freight transport is still down from a year ago. New home sales remain below last year’s level as well. “The mixed data send a clear message that markets should not be too bullish about growth this year,” Nomura’s chief China Economist Ting Lu said.
The world’s third-largest economy expanded an annualized 0.6% in the final quarter of last year after slumping a revised 1.0% in July-September, Japan’s government reported. The increase in gross domestic product (GDP) was much smaller than a median market forecast for a 2.0% rise, due to a downswing in capital expenditure and inventory. “With other advanced economies heading into recessions, we still expect net trade to drag Japan into a recession as well in the first half, especially since business investment is weakening faster than we had expected,” said Darren Tay, Japan economist at Capital Economics.
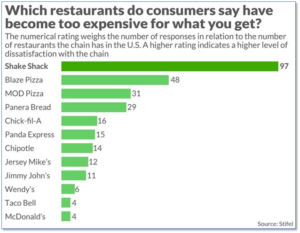
Finally: When it comes to getting the best ‘bang-for-your-buck’ when dining out, a recent survey by Stifel shows that most consumers feel they’re getting the best value from fast-food behemoths like McDonald’s and Taco Bell. At the other end of the scale, New York-based Shake Shack was rated the worst value with the average cost of a popular meal coming in at $13.50—just below Chipotle and Panera in price, but way lower in perceived value. A Shake Shack representative dismissed their poor rating, saying the chain has “dynamic and fun products, providing our guests with elevated, premium, high-quality ingredients that they can’t find in traditional fast food, other fast casual concepts or even casual dining.” Dynamic and fun or not, it was rated more overpriced than any other “fast” or “fast casual” chain, and by a lot. (Data from Stifel, chart from Marketwatch.com)
(Sources: All index- and returns-data from Yahoo Finance; news from Reuters, Barron’s, Wall St. Journal, Bloomberg.com, ft.com, guggenheimpartners.com, zerohedge.com, ritholtz.com, markit.com, financialpost.com, Eurostat, Statistics Canada, Yahoo! Finance, stocksandnews.com, marketwatch.com, wantchinatimes.com, BBC, 361capital.com, pensionpartners.com, cnbc.com, FactSet.) Content provided by WE Sherman and Company. Securities offered through Registered Representatives of Cambridge Investment Research Inc., a broker-dealer, member FINRA/SIPC. Advisory Services offered through Cambridge Investment Research Advisors, a Registered Investment Adviser. Strategic Investment Partners and Cambridge are not affiliated. Indices mentioned are unmanaged and cannot be invested into directly. Past performance is no guarantee of future results. These opinions of Strategic Investment Partners and not necessarily those of Cambridge Investment Research, are for informational purposes only and should not be construed or acted upon as individualized investment advice.