
2-18-19 Weekly Market Update
The very big picture:
In the “decades” timeframe, the current Secular Bull Market could turn out to be among the shorter Secular Bull markets on record. This is because of the long-term valuation of the market which, after nine years, has reached the upper end of its normal range.
The long-term valuation of the market is commonly measured by the Cyclically Adjusted Price to Earnings ratio, or “CAPE”, which smooths out shorter-term earnings swings in order to get a longer-term assessment of market valuation. A CAPE level of 30 is considered to be the upper end of the normal range, and the level at which further PE-ratio expansion comes to a halt (meaning that increases in market prices only occur in a general response to earnings increases, instead of rising “just because”).
Of course, a “mania” could come along and drive prices higher – much higher, even – and for some years to come. Manias occur when valuation no longer seems to matter, and caution is thrown completely to the wind as buyers rush in to buy first and ask questions later. Two manias in the last century – the 1920’s “Roaring Twenties” and the 1990’s “Tech Bubble” – show that the sky is the limit when common sense is overcome by a blind desire to buy. But, of course, the piper must be paid and the following decade or two are spent in Secular Bear Markets, giving most or all of the mania gains back.

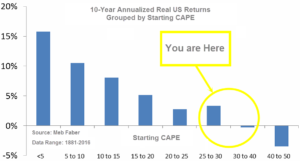
See Fig. 1 for the 100-year view of Secular Bulls and Bears. The CAPE is now at 30.38, up from the prior week’s 29.75, about the level reached at the pre-crash high in October, 2007. Since 1881, the average annual return for all ten year periods that began with a CAPE around this level have been in the 0% – 3%/yr. range. (see Fig. 2).
In the big picture:
The “big picture” is the months-to-years timeframe – the timeframe in which Cyclical Bulls and Bears operate. The U.S. Bull-Bear Indicator (see Fig. 3) is in Cyclical Bull territory at 59.65, up from the prior week’s 57.13.

In the intermediate and Shorter-term picture:
The Shorter-term (weeks to months) Indicator (see Fig. 4) turned positive on November 28th. The indicator ended the week at 36, unchanged from the prior week. Separately, the Intermediate-term Quarterly Trend Indicator – based on domestic and international stock trend status at the start of each quarter – was negative entering January, indicating negative prospects for equities in the first quarter of 2019.

Timeframe summary:
In the Secular (years to decades) timeframe (Figs. 1 & 2), the long-term valuation of the market is simply too high to sustain rip-roaring multi-year returns. The Bull-Bear Indicator (months to years) remains positive (Fig. 3), indicating a potential uptrend in the longer timeframe. In the intermediate timeframe, the Quarterly Trend Indicator (months to quarters) is negative for Q1, and the shorter (weeks to months) timeframe (Fig. 4) is positive. Therefore, with two indicators positive and one negative, the U.S. equity markets are rated as Neutral.
In the markets:
U.S. Markets: The major U.S. equity indexes posted gains for an eighth consecutive week as optimism that the U.S. and China would reach a trade deal offset weak December retail sales data. The Dow Jones Industrial Average rallied 777 points to end the week at 25,883, a gain of 3.1%. The technology-heavy NASDAQ Composite rose 2.4%, closing at 7472. Smaller cap benchmarks outperformed large caps with the small cap Russell 2000 and mid cap S&P 400 indexes rising 4.2% and 3.3%, respectively, while the large cap S&P 500 added 2.5%.
International Markets: Almost all major non-U.S. markets finished the week in the green. Canada’s TSX finished the week up 1.3%, while across the Atlantic the United Kingdom’s FTSE rose 2.3%. On Europe’s mainland France’s CAC 40 surged 3.9%, Germany’s DAX retraced all of the previous week’s losses and then some rallying 3.6% and Italy’s Milan FTSE jumped 4.4%. In Asia, China’s Shanghai Composite rose 2.5% and Japan’s Nikkei added 2.8%. As grouped by Morgan Stanley Capital International, developed markets added 2.6%, but emerging markets finished down -0.2%.
Commodities: Precious metals were mixed on the week with Gold rising with equities markets, but silver ending the week down. Gold tacked on 0.3% closing at $1322.10 an ounce, while Silver retreated -0.4% to $15.74 an ounce. Oil continued its rally surging 6.2% to $55.98 per barrel of West Texas Intermediate crude oil. The industrial metal copper, seen as an indicator of global economic health due to its variety of uses, retreated -0.4% after being up in each of the prior five weeks.
U.S. Economic News: The Labor Department reported the number of people applying for first-time unemployment benefits rose by 4000 to a seasonally adjusted 239,000 last week. The reading lifted the monthly average of new jobless claims to a one-year high of 231,750–a possible sign the U.S. labor market may be losing some steam. Jobless claims can be especially volatile following the holiday season, but what’s potentially troubling is that even without seasonal adjustment, the actual number of people seeking benefits was higher in early February than they were a year ago. Continuing claims, which counts the number of people already collecting unemployment benefits, increased by 37,000 to 1.77 million. That number remains near its lowest level in decades.
Also in labor news, the humorously-named JOLTS (Job Openings and Labor Turnover Survey) report showed that the number of job openings surged at the end of last year, hitting an all-time high. The Labor Department reported job openings climbed to 7.34 million in December, up from 7.17 million the prior month. This reading of job openings is at its highest level since the government began keeping track in 2000. It also exceeded by a wide margin the 6.5 million Americans who were officially classified as unemployed during the month. In the details, job openings in construction led the way with an increase of almost 100,000 new positions. Healthcare providers, hotels, and restaurants also posted more available positions. The number of people that voluntarily left their jobs, known as the “quits rate”, remained unchanged at 2.6%.
Inflation at the consumer level remained flat in January, held down by weakness in energy prices and a stronger U.S. dollar. The reading missed consensus expectations of a 0.1% gain. Core CPI, which strips out the volatile food and energy categories, was up 0.2%–in line with the consensus. It was led by higher prices for shelter, medical care, apparel, household furnishings and recreation. On a year-over-year basis, the consumer price index eased to 1.6%–its slowest pace since June of 2017. However, core CPI held steady at 2.2% year-over-year indicating that underlying inflation pressures remain and deflation does not appear to be an imminent threat.
But not all U.S. economic news was good. Retail sales plunged -1.2% in December, the biggest drop since September of 2009 and far short of forecasts of a 0.1% gain. Nearly all major retail categories declined, with some dropping by the most in over a decade. Retailers faced plenty of headwinds in December, including a stock market that was in free-fall, talk of an imminent recession, and the start of a partial government shutdown. However, many economists were skeptical that sales were the disaster the report seemed to indicate. For example, the report showed a 3.9% decline in sales at internet retailers, yet online merchants such as Amazon and eBay reported strong sales gains. Less surprisingly, sales tumbled 3.3% at department stores that have been losing ground for years to mainly internet-based competitors. Ian Shepherdson, chief economist at Pantheon Macroeconomics summed up the dichotomy noting, “These data are so wild that we have to expect hefty upward revisions, but if they stand, they are very unlikely to be representative of the trend over the next few months. The consumer is no longer enjoying tax cuts or falling gas prices, but that’s no reason to expect a rollover.”
Manufacturing activity in the New York-region picked up in February, according to the latest data from the New York Fed. The NY Fed’s Empire State manufacturing index rebounded 4.9 points to 8.8 after hitting its lowest level in a year. Economists had expected a reading of just 7.6. While readings above zero indicate improving conditions, the index remains well below the levels in the 20’s seen last year. The components of the report were mixed as new orders increased slightly, while the shipment index slumped to its lowest level in more than a year.
Sentiment among the nation’s small business owners slumped to its lowest level since the 2016 presidential election, the National Federation of Independent Business (NFIB) reported. The NFIB’s Small Business Optimism Index dropped 3.2 points to 101.2 in January, the most since June 2015. The reading was in line with other measures of business confidence (e.g. the CEO Confidence, Business Roundtable, and CFO Optimism reports), which implies slower economic growth for this year than in 2018. In the details, seven of the ten NFIB components declined, led by a steep decline in the outlook for economic conditions to its lowest level since October of 2016.
Among the nation’s consumers, the University of Michigan reported that sentiment improved this month, rebounding from January’s worst reading since November of 2016. U of M’s Consumer Sentiment index rose 4.3 points to 95.5, exceeding expectations of a 94.0 reading. The end of the government shutdown played a key role, though the University of Michigan said worries about the potential for a second one had a lingering impact in depressing sentiment. The index for expectations rebounded the most, jumping to 86.2 from 79.9. The improvement supports a positive outlook for consumer spending growth in the near-term.
International Economic News: Investors betting that the Bank of Canada will follow the U.S. Federal Reserve’s lead and end its tightening cycle are setting themselves up for disappointment, say market strategists at some of Canada’s biggest banks. Analysts at firms including TD Securities and Scotiabank noted that as central banks around the world have pivoted toward a more dovish interest-rate outlook, traders have been betting Canadian officials will follow suit. However, the analysts argue that the Bank of Canada’s confidence in Canada’s economy suggest it isn’t ready to shift to a neutral stance just yet. “The Fed is probably close to being done at this point, but I suspect that the BOC will have a little bit more tightening to do,” said Shaun Osborne, chief FX strategist at Scotiabank. “We generally think the Canadian economy will pick up again.”
Economists state growth in the United Kingdom won’t hit the Bank of England’s target and it could cut rates this year. ING’s chief economist Robert Carnell believes the UK’s growth rate will likely fall below the central bank’s forecast of 1.2% this year and that interest rates could be cut if Brexit talks continue to head south. “Growth of less than 1.2 percent looks pretty likely, judging just by the way that the economy seems to finally be waking up to what’s about to happen to it. Consumers are sort of retrenching, the housing market is looking dismal, business investment isn’t really happening,” stated Carnell. The Bank of England sharply downgraded its 2019 economic outlook to 1.2% last week. As recently as November, the Bank had projected growth of 1.7% this year.
France is expected to have first quarter economic growth of 0.4%, the Bank of France stated in its monthly business survey this week. The estimate would represent a slight improvement from the fourth quarter of 2018 when the French economy grew by 0.3%. The estimate comes as government officials analyze the impact of the “yellow vest” protests on the country’s economy. The French government stated it had provided 38 million euros ($43 million) in financial aid for workers who have been put on reduced work hours as businesses struggle with anti-government protests. Businesses in the city centers saw revenue fall by 20% to 40% on average in recent weeks due to demonstrations taking place every Saturday.
Europe’s economic engine Germany narrowly avoided falling into recession during the final three months of last year. Europe’s largest economy registered zero economic growth during the fourth quarter of 2018, the country’s Federal Statistics Office said. That means it avoided two consecutive quarters of contraction, which is the commonly-accepted definition of a recession. A weak trade performance dragged on the economy, and consumer spending remained subdued. The zero growth recorded in the October-to-December period followed a 0.2% contraction in the previous quarter. Reasons for slower growth last year include a slowdown in the global economy and a weaker car sector, with German consumers less willing to buy new cars amid confusion over new emission standards.
China’s trade data came in much stronger than expected last month, but it doesn’t mean that everything is suddenly all well in the world’s second-biggest economy, analysts say. One reason is that the strong figures may be due to the February Lunar New Year holiday falling 11 days earlier this year than last. Factories likely rushed to fill orders last month ahead of the weeklong shutdown. Overall, Chinese exports rose 9.1% from a year ago in January, while economists had expected a 3.2% drop. Imports fell just 1.5%–much better than the 10% decline economists had forecast. Analysts also note that the strong January data followed a horrendously bad December when exports and imports had fallen the most since late 2016. Still, on a three-month-average basis, Chinese exports and imports are still on a notable downtrend.
The Japanese economy rebounded in the final quarter of last year thanks to robust spending by households and companies, but some economists note that worries about China and weaker spending might limit growth this year. The world’s third-largest economy expanded at a 1.4% annualized pace in the fourth quarter of last year, following a 2.6% contraction the previous quarter. The reading was in line with forecasts. Daiwa Securities economist Mari Iwashita stated in a note to clients, “Growth in the October-December period was led by domestic demand, but Japan may not be able to keep high levels of consumption and capital expenditures in the January-March period.” Iwashita wasn’t the only economist concerned about the sustainability of economic growth. Goldman Sachs economist Naohiko Baba noted, “Risk is tilted toward the downside, in our view, with further economic slowdown in China and around the globe and deterioration in sentiment due to trade friction as the main downside risk factors.”
Finally: U.S. President Donald Trump declared a national emergency at the U.S.-Mexico border during remarks about border security and announced that he will indeed build his border wall by Executive Order. Senior administration officials explained that the money (which adds up to more than $8 billion – much more than the $5.7 billion the President had been requesting) will come from the following areas:
$1.375 billion from the Homeland Security appropriations bill
$600 million from the Treasury Department’s drug forfeiture fund
$2.5 billion from the Department of Defense’s drug interdiction program
$3.6 billion from the Department of Defense’s military construction account.
A congressional aide, who spoke on condition of anonymity, said Trump could theoretically divert up to $21 billion in military construction funds that aren’t already obligated for use on border projects. Much of the $21 billion could be taken from the “wartime funds” account, which is known as the overseas contingency operations, or OCO. “[The president] is free to spend without a vote from Congress,” the aide said of the immediately available $21 billion. “He has to notify Congress of what he’s done but he doesn’t have to come to Congress to do it.”

(sources: all index return data from Yahoo Finance; Reuters, Barron’s, Wall St Journal, Bloomberg.com, ft.com, guggenheimpartners.com, zerohedge.com, ritholtz.com, markit.com, financialpost.com, Eurostat, Statistics Canada, Yahoo! Finance, stocksandnews.com, marketwatch.com, wantchinatimes.com, BBC, 361capital.com, pensionpartners.com, cnbc.com, FactSet) These are the opinions of WE Sherman and Co and not necessarily those of Cambridge, are for informational purposes only, and should not be construed or acted upon as individualized investment advice.
Securities offered through Registered Representatives of Cambridge Investment Research Inc., a broker-dealer, member FINRA/SIPC. Advisory Services offered through Cambridge Investment Research Advisors, a Registered Investment Adviser. Strategic Investment Partners and Cambridge are not affiliated.
Indices mentioned are unmanaged and cannot be invested into directly. Past performance is no guarantee of future results. All Investing involves risk. Depending on the types of investments, there may be varying degrees of risk. Investors should be prepared to bear loss, including total loss of principal.