
2-14-2022 Weekly Market Update
The very Big Picture
The long-term valuation of the market is commonly measured by the Cyclically Adjusted Price to Earnings ratio, or “CAPE”, which smooths-out shorter-term earnings swings in order to get a longer-term assessment of market valuation. A CAPE level of 30 is considered to be the upper end of the normal range, and the level at which further PE-ratio expansion comes to a halt (meaning that further increases in market prices only occur as a general response to earnings increases, instead of rising “just because”). The market is now above at that level.
Of course, a “mania” could come along and drive prices higher – much higher, even – and for some years to come. Manias occur when valuation no longer seems to matter, and caution is thrown completely to the wind – as buyers rush in to buy first, and ask questions later. Two manias in the last century – the “Roaring Twenties” of the 1920s, and the “Tech Bubble” of the late 1990s – show that the sky is the limit when common sense is overcome by a blind desire to buy. But, of course, the piper must be paid, and the following decade or two were spent in Secular Bear Markets, giving most or all of the mania-gains back.
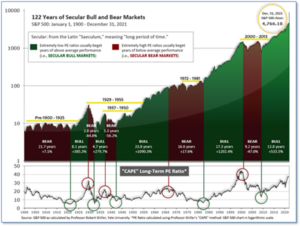
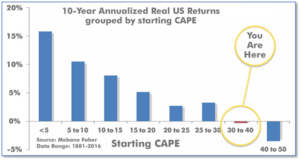
See Fig. 1 for the 100-year view of Secular Bulls and Bears. The CAPE is now at 36.17, down from the prior week’s 37.18. Since 1881, the average annual return for all ten-year periods that began with a CAPE in this range has been negative (see Fig. 2).
Note: We do not use CAPE as an official input into our methods. However, if history is any guide – and history is typically ‘some’ kind of guide – it’s always good to simply know where we are on the historic continuum, where that may lead, and what sort of expectations one may wish to hold in order to craft an investment strategy that works in any market ‘season’ … whether the current one, or one that may be ‘coming soon’!
The Big Picture:
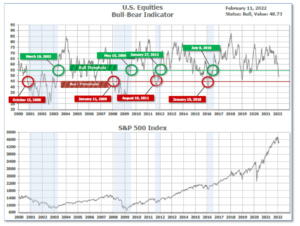
The ‘big picture’ is the (typically) years-long timeframe – the timeframe in which Cyclical Bulls and Bears operate. The U.S. Bull-Bear Indicator is in Cyclical Bull territory at 48.73, down from the prior week’s 50.35.
In the Quarterly- and Shorter-term Pictures
The Quarterly-Trend Indicator based on the combination of U.S. and International Equities trend-statuses at the start of each quarter – was Positive entering January, indicating positive prospects for equities in the fourth quarter of 2021.
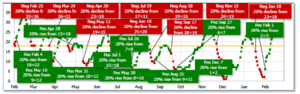
Next, the short-term(weeks to months) Indicator for US Equities turned positive on February 1, and ended the week at 22, up from the prior week’s 13.
In the Markets:
U.S. Markets: Another volatile week in the U.S. markets; the large-cap indexes ended the week lower, but the S&P Midcap 400 and small-cap Russell 2000 recorded modest gains. The Dow Jones Industrial Average shed 352 points finishing the week at 34,738—a decline of 1%. The technology-heavy Nasdaq Composite fared the worst and ended the week down -2.2% remaining in a correction, defined as a 10% decline from a recent peak. By market cap, the large cap S&P 500 declined -1.8%, while mid caps added 0.9% and small caps rose 1.4%.
International Markets: International markets were mixed on the week, but many of the “headline” markets were positive. Canada’s TSX rose for a third week, adding 1.3%, while the United Kingdom’s FTSE 100 added 1.9%. France’s CAC 40 gained 0.9%. Germany’s DAX rebounded 2.2%. In Asia, China’s Shanghai Composite surged 3%. And Japan’s Nikkei finished the week up 0.9%. As grouped by Morgan Stanley Capital International, developed markets closed down -0.5%, but emerging markets ticked up 0.1%.
Commodities: Precious metals led the way in major commodities, unsurprising given the hotter-than-expected inflation numbers. Silver surged 4% to $23.37 per ounce, while Gold gained 1.9% to $1842.10. Crude oil had its eighth consecutive week of gains. West Texas Intermediate crude oil tacked on an additional 0.9% to $93.10 per barrel. The industrial metal copper, viewed by some analysts as a barometer of world economic health due to its wide variety of uses, finished the week up 0.4%.
U.S. Economic News: The number of Americans filing first time unemployment benefits fell by 16,000 to 223,000 last week, the Labor Department reported. That was the lowest level since late December and below forecasts. Economists had estimated new claims would total 230,000. Meanwhile, continuing claims, which counts the number of people already collecting benefits, remained unchanged at 1.62 million. That reading is now back to pre-crisis levels.
Following another sharp increase in consumer prices, the US inflation-rate climbed to 7.5% – a 40-year high. Big increases in the cost of rent food and energy drove the consumer price index up 0.6% in the first month of the new year. The increase greatly exceeded Wall Street’s forecast of a 0.4% gain. The 7.5% surge in the cost of living in the past 12 months is the biggest since February 1982. The Fed is widely expected to raise interest rates in March for the first time in four years in an effort to curb inflation. A separate measure of consumer inflation that strips out the often-volatile food and energy prices, so called “core inflation”, rose 0.6% last month. The annual rate of core inflation rose half a percentage point to 6% – its highest level since August of 1982. Price increases have spread throughout the economy and the businesses are still suffering from widespread shortages of labor and supplies, not to mention shipping delays and higher transportation costs. Andrew Hunter, U.S. economist at Capital Economics, doesn’t expect inflation to abate anytime soon. In a research note he wrote: “A rapid cyclical acceleration in inflation is underway and, with labor market conditions exceptionally tight, it is unlikely to abate any time soon.”
After paying down debt in 2020, consumers resumed borrowing in 2021, with credit rising by 5.9% to $4.4 trillion—its largest increase in five years. The Federal Reserve reported total consumer credit rose $18.9 billion in December. Economists had been expecting a $24 billion gain. That brought the annual rate of consumer borrowing down to 5.4% from 10.7% the prior month. Revolving credit, like credit cards, rose at a 2.4% rate in December following a 22.8% gain the prior month. Non-revolving credit, typically auto and student loans, rose 6% following a 7% growth rate in November. Sal Guatieri, senior economist at BMO Capital Markets, said consumers are being pulled in two directions this year. Rising wealth and high household savings from the pandemic tend to bolster spending, but inflation, higher interest rates and the suspension of the child tax credit may restrain spending.
The number of small businesses that raised prices in January rose to its highest level in 48 years, a small-business lobbying group reported. The National Federation of Independent Businesses (NFIB) reported a net 61% of small businesses increased their prices at the beginning of the year. That was the highest percentage since 1974. Meanwhile the NFIB small business optimism index slipped 1.8 points to 97.1 – an 11-month low. NFIB chief economist Bill Dunkelberg stated, “More small business owners started the new year raising prices in an attempt to pass on higher inventory, supplies, and labor costs.” And undoubtedly adding fuel to the inflationary fire, Dunkelberg wrote “Owners are also raising compensation at record high rates to attract qualified employees to their own positions.”
Sentiment among the nation’s consumers plunged to a “stunning” decade low, according to a recent report. The University of Michigan reported its gauge of consumer sentiment fell half a point to 61.7 in February – its lowest reading since October of 2011. Economists were expecting a reading of 67. The survey of consumers reported expectations for inflation over the next year rose to 5% this month, up 0.1% from January, while inflation expectations for the next five years held steady at 3.1%. Also in the survey, consumer’s views of current conditions fell to 68.5 in February from 72 in January, while an indicator of expectations fell to 57.4 from 64.1 in the previous month. Richard Curtin, chief economist of the survey, called February’s decline “stunning,” adding that “the recent declines have been driven by weakening personal financial prospects, largely due to rising inflation, less confidence in the government’s economic policies, and the least favorable long term economic outlook in a decade.”
International Economic News: Canada’s police began clearing ‘Freedom Convoy’ demonstrators on Ontario’s vital U.S.-Canada border crossing. Police in Windsor, Ontario, said Saturday morning they had “commenced enforcement” at the Ambassador Bridge, a key trade corridor to Detroit. By late morning, police had begun steadily pushing protesters away from the bridge and removing their vehicles. The ‘Freedom Convoy’ began as a protest to Canada’s vaccine mandates for truckers by Prime Minister Justin Trudeau and additional COVID-19 measures. General Motors, Ford Motor and Toyota Motor have been forced to cut production at several plants in the U.S. and Canada this week due to a lack of parts, partly due to the blockade. PM Trudeau inflamed the situation by calling the truckers Nazis and White Supremacists, which both angered and amused the many Sikh truckers who comprise a significant share of the Canadian trucking industry.
Across the Atlantic, the British economy grew 7.5% in 2021 retracing almost all of its historic pandemic plunge of ‑9.4% in 2020. On a quarterly basis, U.K. GDP (gross domestic product) is estimated to have increased by 1% in the final three months of the year. It follows a downwardly revised 1% increase the previous quarter, the Office for National Statistics (ONS) said. The largest contributors to the quarterly rise in output were from “human health and social work activities, driven by increased GP visits at the start of the quarter,” according to the ONS, along with a “large increase in coronavirus (Covid-19) testing and tracing activities and the extension of the vaccination program.” Emma Mogford, fund manager of the Premier Miton Monthly Income Fund wrote, “The UK’s self-imposed lockdown to ‘protect Christmas’ has turned out to have only a mild impact on growth in December. This is an encouraging sign for the health of the economy.”
On Europe’s mainland, France posted a record trade deficit last year as imports surged on higher energy prices and exports of big-ticket items like Airbus jets fell. The trade deficit in goods hit 84.7 billion euros ($97 billion) in 2021, equivalent to 3.4% of economic output, as the energy import bill swelled to 43.1 billion euros, the trade ministry said. In December alone, the trade gap reached more than 11 billion euros in the biggest monthly shortfall between exports and imports since French customs records began in 1970. Finance Minister Bruno Le Maire said the deficit marked a “blemish” on Macron’s presidency which has otherwise been particularly strong on the economy. Growth hit a 52-year high last year of 7% as the European Union’s second-biggest economy recovered faster than expected from the coronavirus crisis.
German exports increased for the third consecutive month in December, capping a year in which they rose 14% compared with 2020, official figures showed. The Federal Statistical Office said that exports from Europe’s biggest economy were up 0.9% in December compared with the previous month. That followed gains of 1.8% in November and 3.9% in October. Imports were up 5.7% in December, their fifth consecutive monthly increase. Last year, exports rose 14% to some 1.38 trillion euros ($1.57 trillion). Imports were up 17.1% at over 1.2 trillion euros ($1.37 trillion). The United States remained Germany’s top export destination, with China second and France third. China was the biggest source of imports to Germany, followed by the Netherlands and the U.S.
Two years ago, former President Donald Trump struck a trade deal with China obtaining commitments by the Chinese to purchase vast sums of American exports. The deal has failed miserably. According to Chad Bown at the Peterson Institute for International Economics, U.S. exports to China since then have only been 57% of what was pledged as part of the deal. Not only that, they’re below the levels set before the trade dispute even began. Under the deal, China was to buy $274.5 billion in American goods and services covered by the deal in 2021. The actual number so far is $154.5 billion. Ultimately, Bown writes, “President Trump’s trade war and phase one agreement did little to change China’s economic policymaking.”
Japan’s Prime Minister Fumio Kishida announced plans to keep COVID-19 restrictions for Tokyo and 12 other areas for three more weeks until early March, as omicron infections show little signs of slowing in many prefectures. The current measures covering Tokyo and neighboring areas, Aichi in central Japan and Nagasaki in the south were initially scheduled to end Sunday but will remain until March 6, Kishida said. Nationwide, Japan on Tuesday logged more than 92,000 confirmed cases. Kishida’s decision follows requests from governors in the affected areas, where daily cases are beginning to overwhelm hospitals with more serious ones among the elderly.
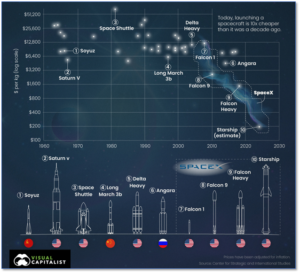
Finally: In December, SpaceX’s Falcon 9 rocket launched a cargo capsule to deliver supplies and Christmas gifts to astronauts in the International Space Station. Like several SpaceX rockets before it, this rocket’s first stage returned to Earth and landed safely on one of SpaceX’s drone ships for refurbishment and reuse. The infographic below shows the cost per kilogram of cargo for space launches across the globe since the dawn of the Space Age in 1960. Today a private-enterprise SpaceX rocket can deliver cargo 97% cheaper than a 1960’s Soviet Soyuz rocket, and 10x cheaper than just a decade ago. Thank you, capitalism (and Elon Musk)! (Chart from Visual Capitalist)
(Sources: All index- and returns-data from Yahoo Finance; news from Reuters, Barron’s, Wall St. Journal, Bloomberg.com, ft.com, guggenheimpartners.com, zerohedge.com, ritholtz.com, markit.com, financialpost.com, Eurostat, Statistics Canada, Yahoo! Finance, stocksandnews.com, marketwatch.com, wantchinatimes.com, BBC, 361capital.com, pensionpartners.com, cnbc.com, FactSet.) Securities offered through Registered Representatives of Cambridge Investment Research Inc., a broker-dealer, member FINRA/SIPC. Advisory Services offered through Cambridge Investment Research Advisors, a Registered Investment Adviser. Strategic Investment Partners and Cambridge are not affiliated. Indices mentioned are unmanaged and cannot be invested into directly. Past performance is no guarantee of future results.